SigNoz helps developer monitor applications and troubleshoot problems in their deployed applications

SigNoz-logo

Monitor your applications and troubleshoot problems in your deployed applications, an open-source alternative to DataDog, New Relic, etc.

License Downloads GitHub issues tweet

SigNoz helps developer monitor applications and troubleshoot problems in their deployed applications. SigNoz uses distributed tracing to gain visibility into your software stack.

👉 You can see metrics like p99 latency, error rates for your services, external API calls and individual end points.

👉 You can find the root cause of the problem by going to the exact traces which are causing the problem and see detailed flamegraphs of individual request traces.

SigNoz Feature

👇 Features:

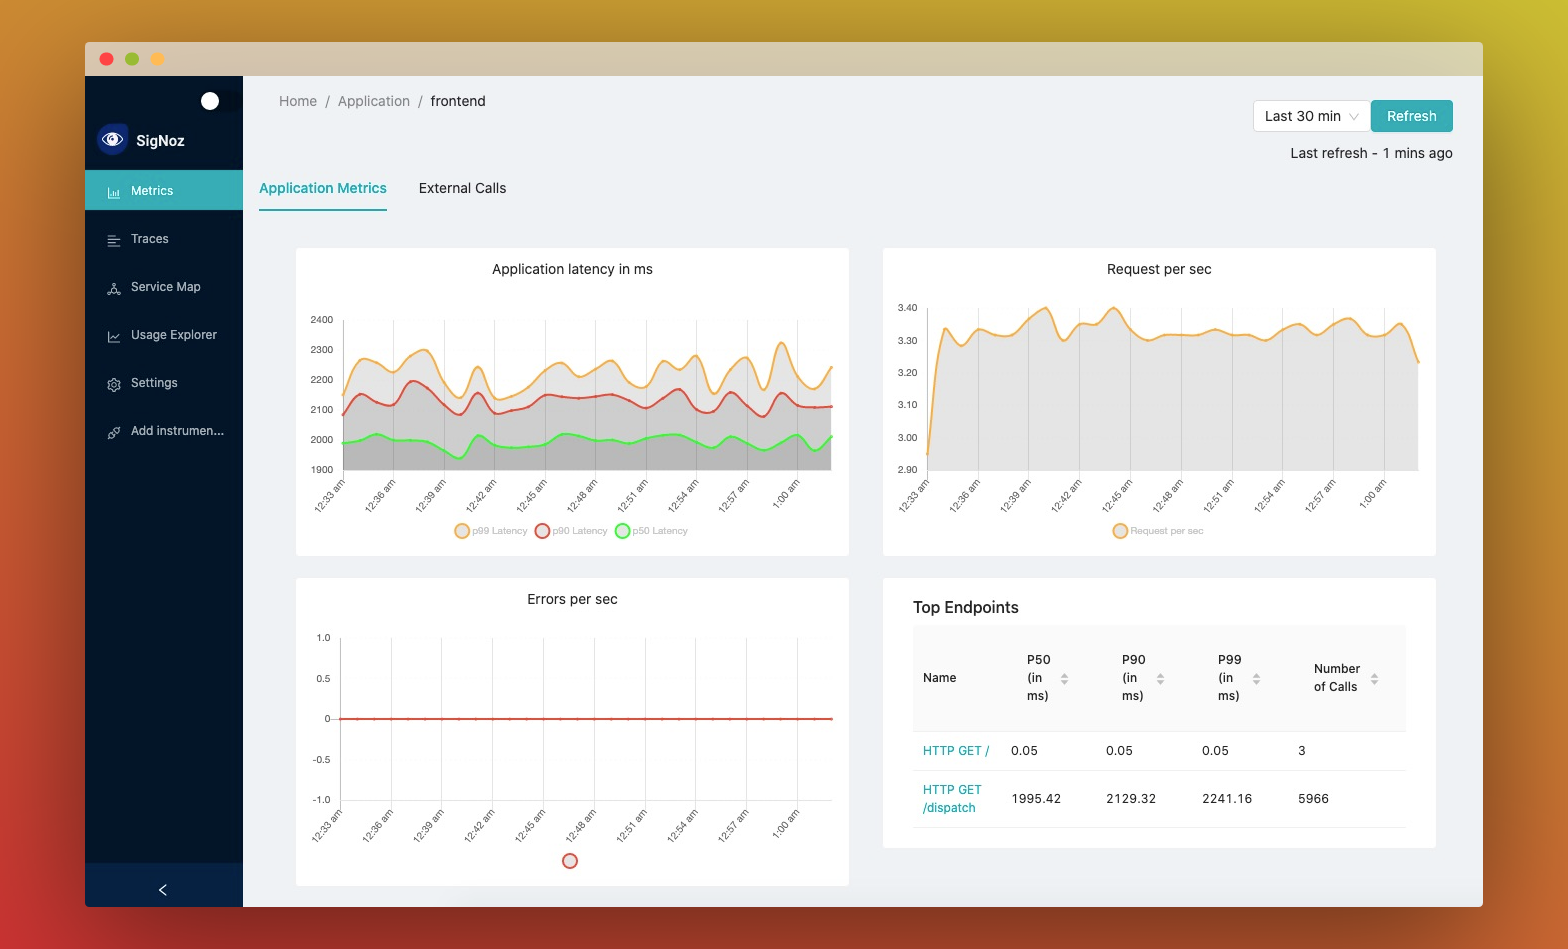
  • Application overview metrics like RPS, 50th/90th/99th Percentile latencies, and Error Rate
  • Slowest endpoints in your application
  • See exact request trace to figure out issues in downstream services, slow DB queries, call to 3rd party services like payment gateways, etc
  • Filter traces by service name, operation, latency, error, tags/annotations.
  • Aggregate metrics on filtered traces. Eg, you can get error rate and 99th percentile latency of customer_type: gold or deployment_version: v2 or external_call: paypal
  • Unified UI for metrics and traces. No need to switch from Prometheus to Jaeger to debug issues.

🤓 Why SigNoz?

Being developers, we found it annoying to rely on closed source SaaS vendors for every small feature we wanted. Closed source vendors often surprise you with huge month end bills without any transparency.

We wanted to make a self-hosted & open source version of tools like DataDog, NewRelic for companies that have privacy and security concerns about having customer data going to third party services.

Being open source also gives you complete control of your configuration, sampling, uptimes. You can also build modules over SigNoz to extend business specific capabilities

👊🏻 Languages supported:

We support OpenTelemetry as the library which you can use to instrument your applications. So any framework and language supported by OpenTelemetry is also supported by SigNoz. Some of the main supported languages are:

  • Java
  • Python
  • NodeJS
  • Go

You can find the complete list of languages here - https://opentelemetry.io/docs/

Getting Started

Deploy using docker-compose

We have a tiny-cluster setup and a standard setup to deploy using docker-compose. Follow the steps listed at https://signoz.io/docs/deployment/docker/. The troubleshooting instructions at https://signoz.io/docs/deployment/docker/#troubleshooting may be helpful

Deploy in Kubernetes using Helm.

Below steps will install the SigNoz in platform namespace inside your k8s cluster.

git clone https://github.com/SigNoz/signoz.git && cd signoz
helm dependency update deploy/kubernetes/platform
kubectl create ns platform
helm -n platform install signoz deploy/kubernetes/platform
kubectl -n platform apply -Rf deploy/kubernetes/jobs
kubectl -n platform apply -f deploy/kubernetes/otel-collector

*You can choose a different namespace too. In that case, you need to point your applications to correct address to send traces. In our sample application just change the JAEGER_ENDPOINT environment variable in sample-apps/hotrod/deployment.yaml

Test HotROD application with SigNoz

kubectl create ns sample-application
kubectl -n sample-application apply -Rf sample-apps/hotrod/

How to generate load

kubectl -n sample-application run strzal --image=djbingham/curl --restart='OnFailure' -i --tty --rm --command -- curl -X POST -F 'locust_count=6' -F 'hatch_rate=2' http://locust-master:8089/swarm

See UI

kubectl -n platform port-forward svc/signoz-frontend 3000:3000

How to stop load

kubectl -n sample-application run strzal --image=djbingham/curl --restart='OnFailure' -i --tty --rm --command -- curl http://locust-master:8089/stop

Documentation

You can find docs at https://signoz.io/docs/deployment/docker. If you need any clarification or find something missing, feel free to raise a GitHub issue with the label documentation or reach out to us at the community slack channel.

Community

Join the slack community to know more about distributed tracing, observability, or SigNoz and to connect with other users and contributors.

If you have any ideas, questions, or any feedback, please share on our Github Discussions

Owner
SigNoz
Open source Observability Platform
SigNoz
Comments
  • otel-collector panic: runtime error: invalid memory address or nil pointer dereference

    otel-collector panic: runtime error: invalid memory address or nil pointer dereference

    Bug description

    Hello opentelemetry-collector can't run because of error

    Expected behavior

    2022-07-27T11:46:33.354Z	info	service/collector.go:124	Everything is ready. Begin running and processing data.
    panic: runtime error: invalid memory address or nil pointer dereference
    [signal SIGSEGV: segmentation violation code=0x1 addr=0x28 pc=0x1063552]
    
    goroutine 137 [running]:
    github.com/open-telemetry/opentelemetry-collector-contrib/exporter/clickhousemetricsexporter.(*PrwExporter).export.func1()
    	/src/exporter/clickhousemetricsexporter/exporter.go:279 +0xf2
    created by github.com/open-telemetry/opentelemetry-collector-contrib/exporter/clickhousemetricsexporter.(*PrwExporter).export
    	/src/exporter/clickhousemetricsexporter/exporter.go:275 +0x256
    

    How to reproduce

    1. values.yaml
    2. helm upgrade -i signoz signoz/signoz -f values.yaml

    Version information

    • frontend version: '0.10.0'
    • query-service version: '0.10.0'
    • alertmanager version: '0.23.0-0.1'
    • otel-collector version: '0.45.1-1.0'
    • otel-collector-metrics version: '0.45.1-1.0'
    • Chart version: 0.2.0
    • Chart appVersion: 0.10.0

    Additional context

    Thank you for your bug report – we love squashing them!

  • refactor(ports): 💥 avoid exposing unnecessary ports and update frontend port to 3301

    refactor(ports): 💥 avoid exposing unnecessary ports and update frontend port to 3301

    There were users who reported running into issues because they had other applications running on the exact port(s). If any of the ports are required by users, please feel free to expose them on your set up.

    Update: Frontend port changed from 3000 to 3301

    BREAKING CHANGE:

    Signed-off-by: Prashant Shahi [email protected]

  • Time selected changes from 5min to 30min/1hr or vice versa on clicking refresh button

    Time selected changes from 5min to 30min/1hr or vice versa on clicking refresh button

    Bug description

    Time selected changes from 5min to 30min/1hr on clicking refresh

    Expected behavior

    Time selected shouldn't jump from 5min to 30min/1hr on clicking refresh button

    How to reproduce

    1. Open SigNoz UI for the first time - confirm that the time selected is 5min in the /application page
    2. Click any service and go to metrics page, confirm time selected is 5min
    3. Press refresh button beside time selector, the time changes from 5min to 30min.

    This is not repeating everytime though, so need to find exact scenario in which it reproduces

    Version information

    • Signoz version: v0.5.2
    • Browser version: Chrome 96.0.4
    • Your OS and version: macOS Monterey

    Additional context

    https://share.getcloudapp.com/X6ubmGKE

    Thank you for your bug report – we love squashing them!

  • Improve clickhouse performance

    Improve clickhouse performance

    Hi, i'm playing a bit with signoz with Clickhouse as the backend the performance can be improved a lot

    in general, need to create MV in order to make queries more efficient and the main table structure should also change, and put timestamp as leading index(in general it can be done with projections, but did not see any need to use it)

    currently i have around 50m traces, and clickhouse server with 2 vcpu and 8GB RAM queries took between 5-6 seconds to run(some even 20 seconds)

    after my changes, most queries run under 500ms

    also, i did not want to include kafka, so i just created buffer table in clickhouse, it allows a lot of small insertions

    i needed to remove some filters in: SearchSpansAggregate method, but in general, it seems to work pretty well, i need to check on larger scale though(lets say 1 billion records)

    so in general(query service only): need to use MV and populate it most of queries should be performed in front of new aggregated table need to put timestamp to be leading index(or use projections) also, for collector, i would use buffer table

    i can provide working exmaple if needed, i guess it can be improved even more (i deleted druid funcitons from code though)

    tables:

    Buffer:
    CREATE TABLE otel.signoz_index
    (
        `timestamp` DateTime64(9) CODEC(Delta(8), ZSTD(1)),
        `traceID` String CODEC(ZSTD(1)),
        `spanID` String CODEC(ZSTD(1)),
        `parentSpanID` String CODEC(ZSTD(1)),
        `serviceName` LowCardinality(String) CODEC(ZSTD(1)),
        `name` LowCardinality(String) CODEC(ZSTD(1)),
        `kind` Int32 CODEC(ZSTD(1)),
        `durationNano` UInt64 CODEC(ZSTD(1)),
        `tags` Array(String) CODEC(ZSTD(1)),
        `tagsKeys` Array(String) CODEC(ZSTD(1)),
        `tagsValues` Array(String) CODEC(ZSTD(1)),
        `statusCode` Int64 CODEC(ZSTD(1)),
        `references` String CODEC(ZSTD(1)),
        `externalHttpMethod` Nullable(String) CODEC(ZSTD(1)),
        `externalHttpUrl` Nullable(String) CODEC(ZSTD(1)),
        `component` Nullable(String) CODEC(ZSTD(1)),
        `dbSystem` Nullable(String) CODEC(ZSTD(1)),
        `dbName` Nullable(String) CODEC(ZSTD(1)),
        `dbOperation` Nullable(String) CODEC(ZSTD(1)),
        `peerService` Nullable(String) CODEC(ZSTD(1))
    )
    ENGINE = Buffer('otel', 'signoz_index_final', 16, 0, 20, 0, 20000, 0, 10000000)
    
    main table:
    CREATE TABLE otel.signoz_index_final
    (
        `timestamp` DateTime64(9) CODEC(Delta(8), ZSTD(1)),
        `traceID` String CODEC(ZSTD(1)),
        `spanID` String CODEC(ZSTD(1)),
        `parentSpanID` String CODEC(ZSTD(1)),
        `serviceName` LowCardinality(String) CODEC(ZSTD(1)),
        `name` LowCardinality(String) CODEC(ZSTD(1)),
        `kind` Int32 CODEC(ZSTD(1)),
        `durationNano` UInt64 CODEC(ZSTD(1)),
        `tags` Array(String) CODEC(ZSTD(1)),
        `tagsKeys` Array(String) CODEC(ZSTD(1)),
        `tagsValues` Array(String) CODEC(ZSTD(1)),
        `statusCode` Int64 CODEC(ZSTD(1)),
        `references` String CODEC(ZSTD(1)),
        `externalHttpMethod` Nullable(String) CODEC(ZSTD(1)),
        `externalHttpUrl` Nullable(String) CODEC(ZSTD(1)),
        `component` Nullable(String) CODEC(ZSTD(1)),
        `dbSystem` Nullable(String) CODEC(ZSTD(1)),
        `dbName` Nullable(String) CODEC(ZSTD(1)),
        `dbOperation` Nullable(String) CODEC(ZSTD(1)),
        `peerService` Nullable(String) CODEC(ZSTD(1)),
        INDEX idx_traceID traceID TYPE bloom_filter GRANULARITY 4,
        INDEX idx_service serviceName TYPE bloom_filter GRANULARITY 4,
        INDEX idx_spanID spanID TYPE bloom_filter GRANULARITY 64,
        INDEX idx_tagsKeys tagsKeys TYPE bloom_filter(0.01) GRANULARITY 64,
        INDEX idx_tagsKeys_arr arrayJoin(tagsKeys) TYPE bloom_filter GRANULARITY 64,
        INDEX idx_tagsValues tagsValues TYPE bloom_filter(0.01) GRANULARITY 64,
        INDEX idx_duration durationNano TYPE minmax GRANULARITY 1
    )
    ENGINE = MergeTree
    PARTITION BY toDate(timestamp)
    ORDER BY (timestamp, serviceName)
    SETTINGS index_granularity = 8192
    
    Aggregated table:
    CREATE TABLE otel.signoz_index_aggregated
    (
        `timestamp` DateTime CODEC(Delta(8), ZSTD(1)),
        `serviceName` LowCardinality(String) CODEC(ZSTD(1)),
        `statusCode` Int64 CODEC(ZSTD(1)),
        `kind` Int32 CODEC(ZSTD(1)),
        `name` LowCardinality(String) CODEC(ZSTD(1)),
        `dbSystem` Nullable(String) CODEC(ZSTD(1)),
        `dbName` Nullable(String) CODEC(ZSTD(1)),
        `externalHttpMethod` Nullable(String) CODEC(ZSTD(1)),
        `externalHttpUrl` Nullable(String) CODEC(ZSTD(1)),
        `count` Int32,
        `avg` AggregateFunction(avg, UInt64),
        `quantile` AggregateFunction(quantile, UInt64),
        `tagsKeys` Array(String) CODEC(ZSTD(1))
    )
    ENGINE = SummingMergeTree
    PARTITION BY toYYYYMMDD(timestamp)
    ORDER BY (serviceName, kind, statusCode, -toUnixTimestamp(timestamp))
    SETTINGS index_granularity = 8192
  • No Traces

    No Traces

    Greetings, I'm running the signoz with the lateset opentelemetry-python v1.12.0rc2 in docker. Signoz is running with the demo I'm not getting traces from my sample python flask app. If I run:

    OTEL_RESOURCE_ATTRIBUTES=service.name="inspired" OTEL_EXPORTER_OTLP_ENDPOINT="localhost:4318" opentelemetry-instrument --traces_exporter otlp_proto_http,console flask run

    I see the output on the console but nothing shows on the Signoz frontend.

    the python app:

    from opentelemetry import trace
    from opentelemetry.exporter.jaeger.thrift import JaegerExporter
    from opentelemetry.sdk.trace import TracerProvider
    from opentelemetry.sdk.trace.export import BatchSpanProcessor, ConsoleSpanExporter
    from opentelemetry.sdk.resources import SERVICE_NAME, Resource
    
    from random import randint
    from flask import Flask, request
    from time import sleep
    from sys import exit
    
    ################# Metrics Start
    from opentelemetry import metrics
    from opentelemetry.sdk.metrics import MeterProvider
    from opentelemetry.sdk.metrics.export import (ConsoleMetricExporter, PeriodicExportingMetricReader,)
    
    metric_reader = PeriodicExportingMetricReader(ConsoleMetricExporter())
    provider = MeterProvider(metric_readers=[metric_reader])
    
    # Sets the global default meter provider
    metrics.set_meter_provider(provider)
    
    # Creates a meter from the global meter provider
    meter = metrics.get_meter(__name__)
    ################# Metrics end


    # Service name is required for most backends,
    # and although it's not necessary for console export,
    # it's good to set service name anyways.
    resource = Resource(attributes={
        SERVICE_NAME: "inspired"
    })
    '''
    provider = TracerProvider()
    trace.set_tracer_provider(provider)
    tracer = trace.get_tracer(__name__)
    '''
    provider = TracerProvider(resource=resource)
    processor = BatchSpanProcessor(ConsoleSpanExporter())
    provider.add_span_processor(processor)
    trace.set_tracer_provider(provider)
    tracer = trace.get_tracer(__name__)
    
    app = Flask(__name__)
    
    @app.route("/roll")
    def roll():
        sides = int(request.args.get('sides'))
        rolls = int(request.args.get('rolls'))
        sides = 6
        rolls = 1
        total = 0
        while True:
            with tracer.start_as_current_span("roll_sum01"):
                span = trace.get_current_span()
                sum01 = 0
                for r in range(0,1):
                    result = randint(1,6)
                    span.add_event( "log", {
                        "roll.sides": sides,
                        "roll.result": result,
                    })
                    sum01 += result
                    total += result
                with tracer.start_as_current_span("roll_sum02"):
                    span = trace.get_current_span()
                    sum02 = 0
                    for r in range(0,1):
                        result = randint(1,6)
                        span.add_event( "log", {
                            "roll.sides": sides,
                            "roll.result": result,
                        })
                        sum02 += result
                        total += result
                    with tracer.start_as_current_span("roll_sum03"):
                        span = trace.get_current_span()
                        sum03 = 0
                        for r in range(0,1):
                            result = randint(1,6)
                            span.add_event( "log", {
                                "roll.sides": sides,
                                "roll.result": result,
                            })
                            sum03 += result
                            total += result
                        with tracer.start_as_current_span("roll_total"):
                            span = trace.get_current_span()
                            span.add_event( "log", {
                                "roll.total": total,
                            })
                            sleep(5)
            # return  str(f'{sum01},{sum02},{sum03}')


    the otel-collector-config.yaml:

    receivers:
      otlp/spanmetrics:
        protocols:
          grpc:
            endpoint: "localhost:12345"
      otlp:
        protocols:
          grpc:
            endpoint: "localhost:4137"
          http:
            endpoint: "localhost:4138"
      jaeger:
        protocols:
          grpc:
          thrift_http:
      hostmetrics:
        collection_interval: 60s
        scrapers:
          cpu:
          load:
          memory:
          disk:
          filesystem:
          network:
    processors:
      batch:
        send_batch_size: 10000
        send_batch_max_size: 11000
        timeout: 10s
      signozspanmetrics/prometheus:
        metrics_exporter: prometheus
        latency_histogram_buckets: [100us, 1ms, 2ms, 6ms, 10ms, 50ms, 100ms, 250ms, 500ms, 1000ms, 1400ms, 2000ms, 5s, 10s, 20s, 40s, 60s ]
        dimensions_cache_size: 10000
        dimensions:
          - name: service.namespace
            default: default
          - name: deployment.environment
            default: default
      # memory_limiter:
      #   # 80% of maximum memory up to 2G
      #   limit_mib: 1500
      #   # 25% of limit up to 2G
      #   spike_limit_mib: 512
      #   check_interval: 5s
      #
      #   # 50% of the maximum memory
      #   limit_percentage: 50
      #   # 20% of max memory usage spike expected
      #   spike_limit_percentage: 20
      # queued_retry:
      #   num_workers: 4
      #   queue_size: 100
      #   retry_on_failure: true
    extensions:
      health_check: {}
      zpages: {}
    exporters:
      clickhousetraces:
        datasource: tcp://clickhouse:9000/?database=signoz_traces
      clickhousemetricswrite:
        endpoint: tcp://clickhouse:9000/?database=signoz_metrics
        resource_to_telemetry_conversion:
          enabled: true
      prometheus:
        endpoint: "0.0.0.0:8889"
    service:
      extensions: [health_check, zpages]
      pipelines:
        traces:
          receivers: [jaeger, otlp]
          processors: [signozspanmetrics/prometheus, batch]
          exporters: [clickhousetraces]
        metrics:
          receivers: [otlp, hostmetrics]
          processors: [batch]
          exporters: [clickhousemetricswrite]
        metrics/spanmetrics:
          receivers: [otlp/spanmetrics]
          exporters: [prometheus]
    
    
  • OTLP HTTP/1.0 receiver not found in otel collector service

    OTLP HTTP/1.0 receiver not found in otel collector service

    Hi, I lost the OTLP HTTP/1.0 receiver, after upgrading otel collector service to latest signoz/otelcontribcol:0.43.0 version.

    Now I could only use OTLP GRPC receiver port at 4317.

    Earlier I was using OTLP HTTP/1.0 receiver at 55681.

    Found different in the docker-compose port expose for otel-collector service:

    Earlier:-

        ports:
          - "1777:1777"   # pprof extension
          - "8887:8888"   # Prometheus metrics exposed by the agent
          - "14268:14268"       # Jaeger receiver
          - "55678"       # OpenCensus receiver
          - "55680:55680"       # OTLP HTTP/2.0 legacy port
          - "55681:55681"       # OTLP HTTP/1.0 receiver
          - "4317:4317"       # OTLP GRPC receiver
          - "55679:55679" # zpages extension
          - "13133"       # health_check
          - "8889:8889"   # prometheus exporter
    

    Now:-

        ports:
          - "4317:4317"       # OTLP GRPC receiver
    

    Please help, Thanks.

  • add exception page filters support

    add exception page filters support

    Closes https://github.com/SigNoz/signoz/issues/1893

    The filter keywords should be exact. Example: To filter exception type IOError the filter should be IOError, writing just Error or IO won't work. i.e. There's no fuzzy filtering.

  • Error % shown in metrics detail page and in Services List page is different

    Error % shown in metrics detail page and in Services List page is different

    Sometimes the values shown in Error Percentage panel in application detail page doesn't match with the Error % shown in services list page for that application

  • Recheck all table creation and dynamic queries for distributed setup

    Recheck all table creation and dynamic queries for distributed setup

    • [x] metrics @srikanthccv. Eg https://github.com/SigNoz/signoz-otel-collector/pull/34
    • [x] traces @makeavish https://github.com/SigNoz/signoz/issues/1781
    • [x] logs @nityanandagohain. Eg https://github.com/SigNoz/signoz-otel-collector/pull/22
  • Unable to see the actual span for multiple spans in traces Page

    Unable to see the actual span for multiple spans in traces Page

    Bug description

    Unable to see problematic spans in case span number exceeds a certain threshold More details: https://drive.google.com/file/d/1JVUSX9OPl32dDFYHcMQKdaOxlHPcHdw1/view?usp=share_link

    Expected behavior

    There should be a way to scroll horizontally not just vertically

    Or atleast be able to click on the problematic span

    How to reproduce

    Check https://drive.google.com/file/d/1JVUSX9OPl32dDFYHcMQKdaOxlHPcHdw1/view?usp=share_link

  • chore(jest): setup jest for frontend

    chore(jest): setup jest for frontend

    Description

    The PR sets up jest tests in the repo with support of custom matchers from React Testing library.

    Closes https://github.com/SigNoz/signoz/issues/312

    How to Test?

    1. Run cd ./frontend
    2. Run command yarn test
    3. This will run a sample test added for NotFound page.
    4. Run command yarn test:coverage
    5. This will run a sample test added for NotFound page along with coverage report which this test was able to capture.
  • No logs found error due to same start and end timestamp

    No logs found error due to same start and end timestamp

    Steps

    • Open a new browser (important)
    • Open Signoz logs
    • Press next -> previous -> previous
    • Results in no logs found

    image

    Interestingly it doesn't happen all the time.

  • Kubernetes pods logs are not being parsed

    Kubernetes pods logs are not being parsed

    Bug description

    Kubernetes pods logs are not being parsed. Their content is included in the body property instead of being parsed. In the screenshot we can see span_id and trace_id are not being extracted from the log message.

    image

    Expected behavior

    Logs content should be parsed and values like trace_id and span_id should not be empty.

    How to reproduce

    1. Deploy Signoz helm chart into a kubernetes cluster
    2. Deploy a fastify (nodejs webserver) application, which uses pino as its logger, with opentelemetry auto-instrumentation
    3. See logs in the frontend

    Version information

    • Signoz version: 0.12.0
    • Browser version: Safari and latest Chrome
    • Your OS and version: MacOS Monterey (12.5.1)
    • Your CPU Architecture(ARM/Intel):

    Thank you for your bug report – we love squashing them!

  • Can't see Kubernetes pods logs

    Can't see Kubernetes pods logs

    Bug description

    When I deploy default helm chart to my k8s cluster, I can't see logs in "Logs page"

    • I have no errors in k8s with pods.
    NAME                                                 READY   STATUS    RESTARTS   AGE
    chi-signoze-clickhouse-cluster-0-0-0                 1/1     Running   0          3h4m
    signoze-alertmanager-0                               1/1     Running   0          3h4m
    signoze-clickhouse-operator-7df76c4787-967gq         2/2     Running   0          3h4m
    signoze-frontend-68db584964-zx4t4                    1/1     Running   0          3h4m
    signoze-k8s-infra-otel-agent-24cwz                   1/1     Running   0          10m
    signoze-k8s-infra-otel-agent-bm94b                   1/1     Running   0          10m
    signoze-k8s-infra-otel-agent-r2gwz                   1/1     Running   0          10m
    signoze-k8s-infra-otel-agent-v2k5t                   1/1     Running   0          10m
    signoze-k8s-infra-otel-deployment-5cf565ffc5-zms4v   1/1     Running   0          22m
    signoze-otel-collector-89f968c9d-bd8q7               1/1     Running   0          26m
    signoze-otel-collector-metrics-7547bc8db7-ll55h      1/1     Running   0          3h4m
    signoze-query-service-0                              1/1     Running   0          3h4m
    signoze-zookeeper-0
    

    Expected behavior

    I suggest that if I deploy default chart it will be working.

    How to reproduce

    1. helm pull signoz/signoz --untar
    2. helm upgrade --install --create-namespace -n signoze -f values.yaml signoze .
    3. try to find logs in frontend

    Version information

    • Signoz version: 0.12.0
    • Chart version: 0.6.0

    Additional context

    May be it helps Errors: Otel-collector:

    2022-12-28T14:18:19.597Z warn zapgrpc/zapgrpc.go:191 [transport] transport: http2Server.HandleStreams failed to read frame: read tcp 192.168.12.254:4317->192.168.0.150:37728: read: connection reset by peer {"grpc_log": true}
    2022-12-28T14:25:38.720Z warn zapgrpc/zapgrpc.go:191 [transport] transport: http2Server.HandleStreams failed to read frame: read tcp 192.168.12.254:4317->192.168.0.179:58316: read: connection timed out {"grpc_log": true}
    2022-12-28T14:25:38.720Z warn zapgrpc/zapgrpc.go:191 [transport] transport: http2Server.HandleStreams failed to read frame: read tcp 192.168.12.254:4317->192.168.0.179:58312: read: connection timed out {"grpc_log": true}
    
  • ci(deployments): workflows for staging and testing deployments and related changes

    ci(deployments): workflows for staging and testing deployments and related changes

    • docker-standalone: introduce tag environment variables for easy custom deployments
    • Makefile: remove no-cache from all docker build commands
    • Makefile: update target names
      • run-x86 to run-signoz
      • down-x86 to down-signoz
    • Makefile: introduce pull-signoz to pull latest image from standalone docker-compose YAML

    Signed-off-by: Prashant Shahi [email protected]

Gowl is a process management and process monitoring tool at once. An infinite worker pool gives you the ability to control the pool and processes and monitor their status.

Gowl is a process management and process monitoring tool at once. An infinite worker pool gives you the ability to control the pool and processes and monitor their status.

Nov 10, 2022
Go web monitor - A web monitor with golang

Step Download “go installer” and install on your machine. Open VPN. Go to “web-m

Jan 6, 2022
List files and their creation, modification and access time on android

andfind List files and their access, modification and creation date on a Android

Jan 5, 2022
Monitor your network and internet speed with Docker & Prometheus

Stand-up a Docker Prometheus stack containing Prometheus, Grafana with blackbox-exporter, and speedtest-exporter to collect and graph home Internet reliability and throughput.

Dec 26, 2022
Cloudprober is a monitoring software that makes it super-easy to monitor availability and performance of various components of your system.

Cloudprober is a monitoring software that makes it super-easy to monitor availability and performance of various components of your system. Cloudprobe

Dec 30, 2022
Monitor a process and trigger a notification.

noti Monitor a process and trigger a notification. Never sit and wait for some long-running process to finish. Noti can alert you when it's done. You

Jan 3, 2023
System resource usage profiler tool which regularly takes snapshots of the memory and CPU load of one or more running processes so as to dynamically build up a profile of their usage of system resources.

Vegeta is a system resource usage tracking tool built to regularly take snapshots of the memory and CPU load of one or more running processes, so as to dynamically build up a profile of their usage of system resources.

Jan 16, 2022
Kubernetes monitor
Kubernetes monitor

模式说明 对应配置项为collect_mode cadvisor_plugin | kubelet_agent | server_side 三选一 代码为同一套代码 模式名称 部署运行方式 collect_mode配置 说明 夜莺插件形式采集cadvisor raw api 可执行的插件由夜莺age

Nov 18, 2022
MySQL Monitor Script

README.md Introduction mymon(MySQL-Monitor) 是Open-Falcon用来监控MySQL数据库运行状态的一个插件,采集包括global status, global variables, slave status以及innodb status等MySQL运行

Dec 26, 2022
Open Source Supreme Monitor Based on GoLang

Open Source Supreme Monitor Based on GoLang A module built for personal use but ended up being worthy to have it open sourced.

Nov 4, 2022
Hidra is a tool to monitor all of your services without making a mess.

hidra Don't lose your mind monitoring your services. Hidra lends you its head. ICMP If you want to use ICMP scenario, you should activate on your syst

Nov 8, 2022
Go Huobi Market Price Data Monitor

火币(Huobi)价格监控 由于部分交易对火币官方未提供价格监控,因此写了个小程序,长期屯币党可以用它来提醒各种现货价格。 该工具只需要提前安装Go环境和Redis即可。 消息推送使用的「钉钉」,需要提前配置好钉钉机器人(企业群类型、带webhook的机器人)。 使用方法 下载本项目 拷贝根目录下

Oct 13, 2022
Productivity analytics monitor 🧮

Productivity analytics monitor ??

Oct 8, 2021
Monitor the performance of your Ethereum 2.0 staking pool.

eth-pools-metrics Monitor the performance of your Ethereum 2.0 staking pool. Just input the withdrawal credentials that were used in the deposit contr

Dec 30, 2022
Gomon - Go language based system monitor

Copyright © 2021 The Gomon Project. Welcome to Gomon, the Go language based system monitor Welcome to Gomon, the Go language based system monitor Over

Nov 18, 2022
Monitor & detect crashes in your Kubernetes(K8s) cluster

kwatch kwatch helps you monitor all changes in your Kubernetes(K8s) cluster, detects crashes in your running apps in realtime, and publishes notificat

Dec 28, 2022
Fast, zero config web endpoint change monitor

web monitor fast, zero config web endpoint change monitor. for comparing responses, a selected list of http headers and the full response body is stor

Nov 17, 2022
Monitor pipe progress via output to standard error.

Pipe Monitor Monitor pipe progress via output to standard error. Similar to functionality provided by the Pipe Viewer (pv) command, except this comman

Nov 14, 2022
xlog is a logger for net/context aware HTTP applications

⚠️ Check zerolog, the successor of xlog. HTTP Handler Logger xlog is a logger for net/context aware HTTP applications. Unlike most loggers, xlog will

Sep 26, 2022