Interactive dependency graph visualization tool for golang

depgraph

Go Report Card PRs Welcome License Go Reference

Interactive dependency graph visualization tool for golang using the awesome cytoscape graph visualizer.

screenshot

Install

Install via:

go install github.com/becheran/depgraph@latest

Quick Start

Run the depgraph command line tool next to you go.mod file of your project.

The first required argument is the path to the file or module which shall be observed. For example:

depgraph ./main.go

or:

depgraph github.com/becheran/depgraph 

Per default the frontend will be started on http://localhost:3001. The address can be changed via the host flag:

depgraph -host=localhost8080 github.com/becheran/depgraph 
Similar Resources

Tool that can parse Go files into an abstract syntax tree and translate it to several programming languages.

Tool that can parse Go files into an abstract syntax tree and translate it to several programming languages.

GoDMT GoDMT, the one and only Go Data Model Translator. The goal of this project is to provide a tool that can parse Go files that include var, const,

Nov 28, 2022

An SVG-based tool to visualize public transport journeys retrieved from a HAFAS system

An SVG-based tool to visualize public transport journeys retrieved from a HAFAS system

Time-Space Train Planner An SVG-based tool to visualize public transport journeys retrieved from a HAFAS system, in order to see all possible connecti

Dec 17, 2022

Helm : a tool for managing Charts

Helm is a tool for managing Charts. Charts are packages of pre-configured Kubernetes resources.

Aug 25, 2022

go chart is a basic charting library in native golang.

go chart is a basic charting library in native golang.

Package chart is a very simple golang native charting library that supports timeseries and continuous line charts.

Jan 9, 2023

🎨 The adorable charts library for Golang

🎨 The adorable charts library for Golang

go-echarts 🎨 The adorable charts library for Golang. If a language can be used to build web scrapers, it definitely needs to provide a graceful data

Dec 30, 2022

Globe wireframe visualizations in Golang

Globe wireframe visualizations in Golang

globe Globe wireframe visualizations in Golang backed by pinhole. Getting Started Install globe with $ go get -u github.com/mmcloughlin/globe Start wi

Jan 7, 2023

go-echarts 🎨 The adorable charts library for Golang

go-echarts 🎨 The adorable charts library for Golang

go-echarts 🎨 The adorable charts library for Golang. If a language can be used to build web scrapers, it definitely needs to provide a graceful data

Jan 4, 2023

Ltree Visualizer - A golang library to visualize postgres ltree type data using DOT language and Graphviz

Ltree Visualizer - A golang library to visualize postgres ltree type data using DOT language and Graphviz

Ltree Visualizer A golang library to visualize postgres ltree type data using DOT language and Graphviz What is Ltree? Ltree is a data type which is u

Jun 12, 2022

A golang implementation of endlessh exporting Prometheus metrics, visualized by a Grafana dashboard.

A golang implementation of endlessh exporting Prometheus metrics, visualized by a Grafana dashboard.

endlessh-go A golang implementation of endlessh exporting Prometheus metrics, visualized by a Grafana dashboard. Introduction Endlessh is a great idea

Dec 23, 2022
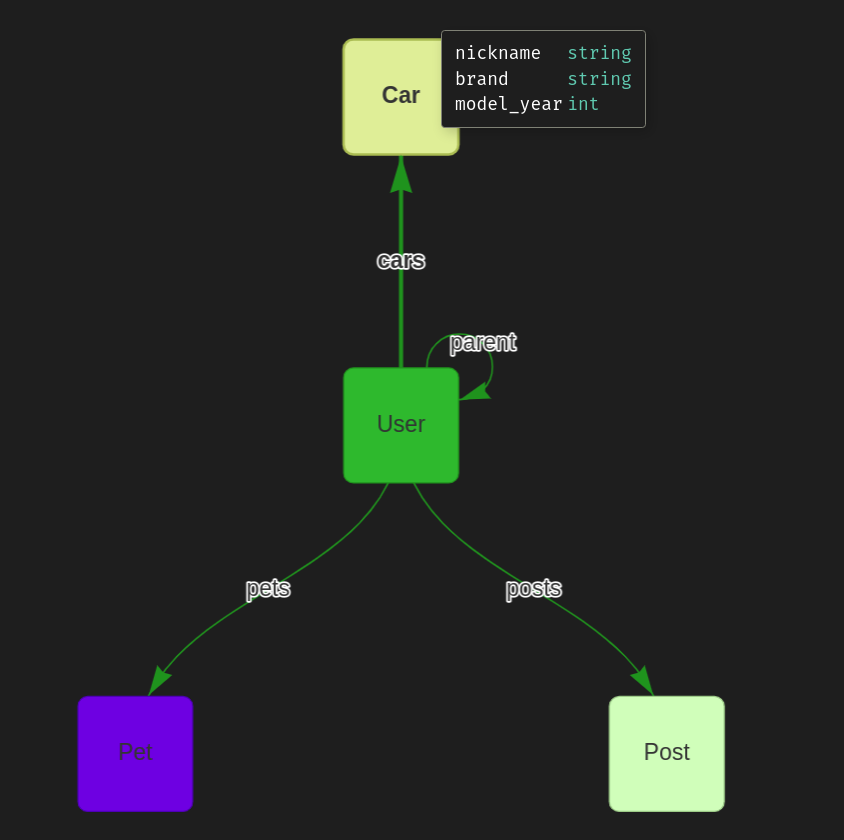
entviz is an ent extension that provides visualization of the schema graph

entviz entviz is an ent extension that creates visual graph (html file) of your ent's schema. install go get github.com/hedwigz/entviz add this exten

Dec 9, 2022
gosivy - Another visualization tool for Go process metrics

gosivy Another visualization tool for Go process metrics. Gosivy tracks Go process's metrics and plot their evolution over time right into your termin

Nov 27, 2022
🚀Statsview is a real-time Golang runtime stats visualization profiler

Statsview is a real-time Golang runtime stats visualization profiler. It is built top on another open-source project, go-echarts, which helps statsview to show its graphs on the browser.

Dec 29, 2022
Callgraph analysis and visualization for Go

Gocyto A Go SSA callgraph builder and visualizer, by @protolambda. Features: output to generic Cytoscape JSON format. (list of nodes, list of edges) o

Nov 3, 2022
Sloop - Kubernetes History Visualization
 Sloop - Kubernetes History Visualization

Sloop - Kubernetes History Visualization Sloop monitors Kubernetes, recording histories of events and resource state changes and providing visualizati

Dec 27, 2022
Data visualization with chart, Create CSV file, Read Write CSV file

Data visualization with chart, Create CSV file, Read Write CSV file, Read from json file and many more in single project ......

Jan 13, 2022
Tool to visualize the graph of embedded structs in Go projects

Visualize a hierarchy of embedded Go structs This tool scans a directory of Go source code files to create a visualization of struct embedding in the

Nov 27, 2022
yml2dot - Turn YAML into beautiful Graph

yml2dot - Turn YAML into beautiful Graph Use Cases Visualize your YAML files as Graph Generate additional info from your source code

Dec 30, 2022
Slice graph uses graphviz in order to pretty print slices for you.

slicegraph Slice graph uses graphviz in order to make you understand what happens underneath your slices.

Sep 22, 2022
Graph a histogram from a stream of timestamps 📈📊

Histogram Timestamps You ever find yourself working with a dataset and you want to graph a particular aspect of that data over time, but because you'r

Dec 4, 2021