Tool to visualize the graph of embedded structs in Go projects

Visualize a hierarchy of embedded Go structs

This tool scans a directory of Go source code files to create a visualization of struct embedding in the project. This can be useful for navigating the data structures of complex projects, or identifying dependencies on particular structures.
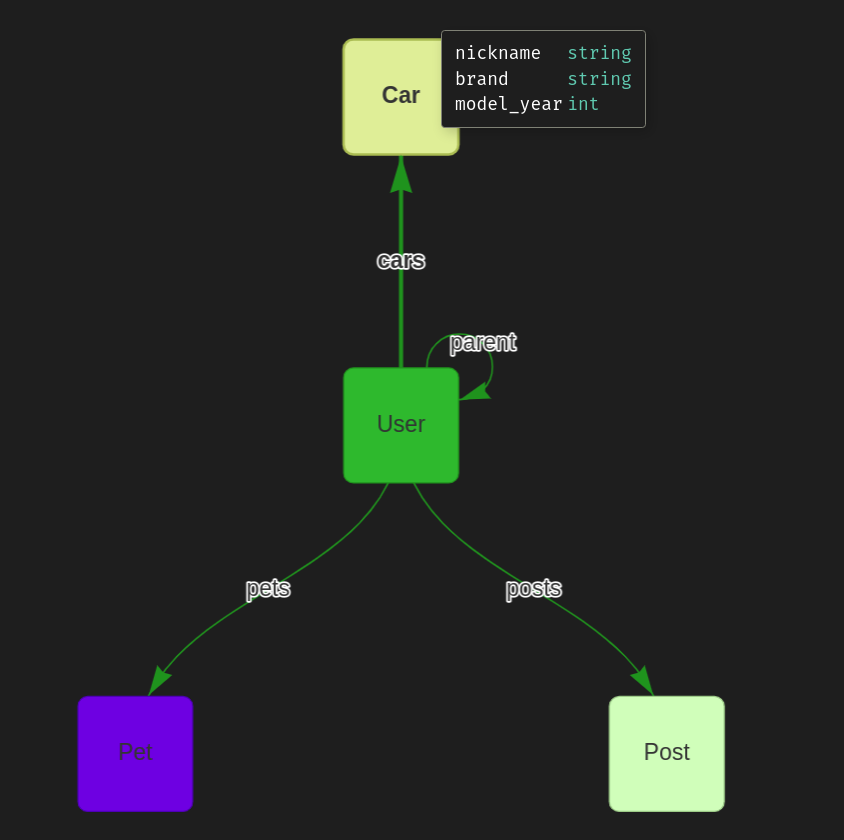
Example

This figure would be generated from the input file below:

visualizer screenshot

package main

import (
	"time"
	"domain.tld/user"
)

type A struct {
	B
	C map[string]D
}

type B struct {
	E, F  string
	G     user.Status
	Timer H
}

type D struct {
	I uint64
}

type H struct {
	Timer time.Ticker
	J     chan D
}

Usage

Install:

$ go install github.com/davidschlachter/embedded-struct-visualizer@latest

Or,

$ git clone https://github.com/davidschlachter/embedded-struct-visualizer
$ cd embedded-struct-visualizer
$ go install github.com/davidschlachter/embedded-struct-visualizer

Options:

$ embedded-struct-visualizer -h
Usage: embedded-struct-visualizer [OPTIONS] DirToScan
If the directory to scan is not provided, it defaults to './'
OPTIONS:
  -out 
   
      path to output file (default: write to stdout)
  -v           verbose logging


To open a generated DOT file, you could use Graphviz or xdot.

Owner
David Schlachter
Software developer making great cloud systems. Background in chemical engineering and biochemistry. https://www.linkedin.com/in/schlachterd/
David Schlachter
Similar Resources

Visualize call graph of a Go program using Graphviz

Visualize call graph of a Go program using Graphviz

go-callvis go-callvis is a development tool to help visualize call graph of a Go program using interactive view. Introduction The purpose of this tool

Dec 31, 2022

Visualize how a projects source code is distributed among its files and folders

Visualize how a projects source code is distributed among its files and folders

Source Code Visualizer Visualize the code distribution in a project. Applications Applications include: Visualizing code distribution for more educate

Jul 31, 2022

K8s-go-structs - All k8s API Go structs

k8s-api go types Why? Its nice to have it all in a single package. . |-- pkg |

Jul 17, 2022

JSONL graph tools - Graph is represented as JSONL of nodes and edges.

JSONL graph tools - Graph is represented as JSONL of nodes and edges.

Sep 27, 2022

The DGL Operator makes it easy to run Deep Graph Library (DGL) graph neural network training on Kubernetes

DGL Operator The DGL Operator makes it easy to run Deep Graph Library (DGL) graph neural network distributed or non-distributed training on Kubernetes

Dec 19, 2022

GoLobby DotEnv is a lightweight package for loading dot env (.env) files into structs for Go projects

DotEnv GoLobby DotEnv is a lightweight package for loading dot env (.env) files into structs for Go projects Documentation Supported Versions It requi

Dec 30, 2022

depth is tool to retrieve and visualize Go source code dependency trees.

depth is tool to retrieve and visualize Go source code dependency trees. Install Download the appropriate binary for your platform from the Rele

Dec 30, 2022

An SVG-based tool to visualize public transport journeys retrieved from a HAFAS system

An SVG-based tool to visualize public transport journeys retrieved from a HAFAS system

Time-Space Train Planner An SVG-based tool to visualize public transport journeys retrieved from a HAFAS system, in order to see all possible connecti

Dec 17, 2022

A command-line tool to visualize a JWT token's content, written in Go

jat A command-line tool to visualize a JWT token's content, written in Go. Usage jat some-jwt Install Navigate to the Releases page; Download the co

Jan 6, 2022

Goimportcycle - a tool to visualize Go imports resolved to the file level

Goimportcycle - a tool to visualize Go imports resolved to the file level

Go Import Cycle goimportcycle is a tool to visualize Go imports resolved to the

Dec 8, 2022

Sixmap - Tool to visualize the SIX (Seattle Internet Exchange) route server coverage

Mapping the SIX route server This program generates an IPv4 map. In particular,

Nov 9, 2022

Clones github projects into ~/Projects/github/{org}/{repo}

Tidy clone Github cli extension (gh extension) to clone repos into ~/Projects/github/{org}/{repo} on the local filesystem Install gh extension install

Jan 19, 2022

The open and composable observability and data visualization platform. Visualize metrics, logs, and traces from multiple sources like Prometheus, Loki, Elasticsearch, InfluxDB, Postgres and many more.

The open and composable observability and data visualization platform. Visualize metrics, logs, and traces from multiple sources like Prometheus, Loki, Elasticsearch, InfluxDB, Postgres and many more.

The open-source platform for monitoring and observability. Grafana allows you to query, visualize, alert on and understand your metrics no matter wher

Jan 3, 2023

Visualize your Go data structures using graphviz

memviz How would you rather debug a data structure? "Pretty" printed Visual graph (*test.fib)(0xc04204a5a0)({ index: (int) 5, prev: (*test.fib)(0xc0

Dec 22, 2022

Visualize plant growth over time with Go, WebDAV and WASM; @pojntfx's entry for #growlab.

Growlapse Visualize plant growth over time with Go, WebDAV and WASM; @pojntfx's entry for #growlab. Installation Containerized You can get the Docker

Feb 21, 2022

Collect and visualize metrics from Brigade 2

Brigade Metrics: Monitoring for Brigade 2 Brigade Metrics adds monitoring capabilities to a Brigade 2 installation. It utilizes Brigade APIs to export

Sep 8, 2022

Ltree Visualizer - A golang library to visualize postgres ltree type data using DOT language and Graphviz

Ltree Visualizer - A golang library to visualize postgres ltree type data using DOT language and Graphviz

Ltree Visualizer A golang library to visualize postgres ltree type data using DOT language and Graphviz What is Ltree? Ltree is a data type which is u

Jun 12, 2022

ncurses matrix/log app written in go to visualize chess problems.

dorrella/matrix-curses Matrix using ncurses and gbin/goncurses. Visual matrix based puzzles Install need libncurses-dev. Probably hard to run on windo

Jan 12, 2022

Btc-globe - Visualize Bitcoin node locations using golang

Btc-globe - Visualize Bitcoin node locations using golang

btc-globe Visualize Bitcoin nodes by location using Golang

Jan 19, 2022
Comments
  • Change default layout to portrait

    Change default layout to portrait

    Change the generated graph to flow from left to right, rather than top to bottom. This will normally create a graph with less horizontal scrolling. It may be useful to allow users to modify the graph direction with a flag, but for now I think it's a sane default.

    Thank you to @dragonly for the suggestion. Closes #4.

  • ignoring imported structs

    ignoring imported structs

    👋🏽 awesome tool!

    It would be awesome if took a flag to stop the recursion whenever it hits a struct from a different module. Running this tool in a production CLI results in a massive amount of branches from low level stdlib and vendored structs, which is more noise than anything else.

    As a small nit: some users may find useful to have an example in the help method that specifies that we emit a dot file. It was not super obvious in the first place

Ltree Visualizer - A golang library to visualize postgres ltree type data using DOT language and Graphviz

Ltree Visualizer A golang library to visualize postgres ltree type data using DOT language and Graphviz What is Ltree? Ltree is a data type which is u

Jun 12, 2022
Interactive dependency graph visualization tool for golang

Interactive dependency graph visualization tool for golang using the awesome cytoscape graph visualizer.

Sep 1, 2022
yml2dot - Turn YAML into beautiful Graph

yml2dot - Turn YAML into beautiful Graph Use Cases Visualize your YAML files as Graph Generate additional info from your source code

Dec 30, 2022
Slice graph uses graphviz in order to pretty print slices for you.

slicegraph Slice graph uses graphviz in order to make you understand what happens underneath your slices.

Sep 22, 2022
entviz is an ent extension that provides visualization of the schema graph

entviz entviz is an ent extension that creates visual graph (html file) of your ent's schema. install go get github.com/hedwigz/entviz add this exten

Dec 9, 2022
Graph a histogram from a stream of timestamps 📈📊

Histogram Timestamps You ever find yourself working with a dataset and you want to graph a particular aspect of that data over time, but because you'r

Dec 4, 2021
Tool that can parse Go files into an abstract syntax tree and translate it to several programming languages.

GoDMT GoDMT, the one and only Go Data Model Translator. The goal of this project is to provide a tool that can parse Go files that include var, const,

Nov 28, 2022
gosivy - Another visualization tool for Go process metrics

gosivy Another visualization tool for Go process metrics. Gosivy tracks Go process's metrics and plot their evolution over time right into your termin

Nov 27, 2022
Helm : a tool for managing Charts

Helm is a tool for managing Charts. Charts are packages of pre-configured Kubernetes resources.

Aug 25, 2022
Visualize call graph of a Go program using Graphviz

go-callvis go-callvis is a development tool to help visualize call graph of a Go program using interactive view. Introduction The purpose of this tool

Jan 1, 2023