🔥 🔥 Open source cloud native security observability platform. Linux, K8s, AWS Fargate and more. 🔥 🔥

Deepfence Logo

GitHub license GitHub stars GitHub issues GitHub wiki Demo Docker pulls Slack Twitter

CVE-2021-44228 Log4J Vulnerability can be detected at runtime and attack paths can be visualized by ThreatMapper.

  • Live demo of Log4J Vulnerability here
  • More details here

ThreatMapper - Runtime Vulnerability Management and Attack Path Enumeration for Cloud Native

Deepfence ThreatMapper hunts for vulnerabilities in your production platforms, and ranks these vulnerabilities based on their risk-of-exploit. You can then prioritize the issues that present the greatest risk to the security of your applications - read more.


Learn the Topology


Identify Vulner­abilities


Discover Attack Paths

See ThreatMapper running with a live demo.

Getting Started with ThreatMapper

ThreatMapper.mp4

Planning your Deployment

The ThreatMapper console can be deployed on a single docker host or in a Kubernetes cluster.

ThreatMapper then monitors your development or production workloads using Sensor Agents. The sensors can be deployed on a wide range of platforms - Kubernetes, Docker, Fargate, Bare-Metal and Virtual Machines. Check the prerequisites before you proceed.

Install the Management Console

Installing the management console on a Docker host (4 cores, 16Gb) is as straightforward as:

wget https://github.com/deepfence/ThreatMapper/raw/master/deployment-scripts/docker-compose.yml
docker-compose -f docker-compose.yml up --detach

Once docker-compose has detached, allow 30 seconds or so for the console to complete its startup. Note that the console uses an untrusted self-signed TLS key by default (how to fix).

Installation on Kubernetes is performed with a Helm Chart:

# Install OpenEBS, and wait for it to start up
kubectl create ns openebs
helm install openebs --namespace openebs --repo "https://openebs.github.io/charts" openebs --set analytics.enabled=false
kubectl get pods -o wide --namespace openebs -w

# Install the Kubernetes metrics service (if not already installed)
kubectl apply -f https://github.com/kubernetes-sigs/metrics-server/releases/download/v0.5.0/components.yaml

# Configure the Deepfence ThreatMapper Helm Chart
helm repo add deepfence https://deepfence-helm-charts.s3.amazonaws.com/threatmapper

# Install the ThreatMapper console and wait for the pods to start up
helm install deepfence-console deepfence/deepfence-console
kubectl get pods -o wide -w

# Optionally, install the Deepfence Router service and wait for the platform to deploy a load balancer
helm install deepfence-router deepfence/deepfence-router
kubectl get --namespace default svc -w deepfence-router

More details are in the ThreatMapper documentation.

Initial Configuration

Once the Management Console is up and running, you can register an admin account and obtain an API key.

When the console first starts up, it will begin to acquire the Threat Intel feed data; this usually takes a few minutes, but can take up to an hour. You can install sensors and browse the topology of your applications, but you will not be able to perform vulnerability scans until the threat feeds have been fully acquired.

Install the ThreatMapper Sensor Agents

Install the Sensor Agents on your production or development platforms. The Sensor Agents report to the Management Console; they tell it what services they discover, provide telemetry and generate manifests of software dependencies.

The following production platforms are supported by ThreatMapper sensors:

  • Amazon ECS: ThreatMapper sensors are deployed as a daemon service using a task definition.
  • AWS Fargate: ThreatMapper sensors are deployed as a sidecar container, using a task definition.
  • Google Kubernetes Engine: ThreatMapper sensors are deployed as a daemonset in the GKE cluster.
  • Azure Kubernetes Service: ThreatMapper sensors are deployed as a daemonset in the AKS cluster.
  • Kubernetes: ThreatMapper sensors are deployed as a daemonset in the Kubernetes cluster, using a helm chart.
  • Docker: ThreatMapper sensors are deployed as a lightweight container.
  • Bare-Metal or Virtual Machines: ThreatMapper sensors are deployed within a lightweight Docker runtime.

For example, run the following command to start the Deepfence Sensor on the Docker host:

docker run -dit --cpus=".2" --name=deepfence-agent --restart on-failure --pid=host --net=host \
  --privileged=true -v /sys/kernel/debug:/sys/kernel/debug:rw -v /var/log/fenced \
  -v /var/run/docker.sock:/var/run/docker.sock -v /:/fenced/mnt/host/:ro \
  -e USER_DEFINED_TAGS="" -e MGMT_CONSOLE_URL="---CONSOLE-IP---" -e MGMT_CONSOLE_PORT="443" \
  -e DEEPFENCE_KEY="---DEEPFENCE-API-KEY---" \
  deepfenceio/deepfence_agent_ce:latest

On a Kubernetes platform, the sensors are installed using a Helm chart:

helm repo add deepfence https://deepfence-helm-charts.s3.amazonaws.com/threatmapper

# helm v2
helm install deepfence/deepfence-agent \
    --name=deepfence-agent \
    --set managementConsoleUrl=---CONSOLE-IP--- \
    --set deepfenceKey=---DEEPFENCE-API-KEY---

# helm v3
helm install deepfence-agent deepfence/deepfence-agent \
    --set managementConsoleUrl=---CONSOLE-IP--- \
    --set deepfenceKey=---DEEPFENCE-API-KEY---

Next Steps

Once the sensor agents have been installed, you can begin to explore the topology of your infrastructure and applications.

Subsequently, when the threat feeds have been acquired, you'll see a message on Settings -> Diagnosis. You can begin with your first Production Vulnerability Scan.

Check out the Deepfence ThreatMapper wiki for how to get started with using Deepfence ThreatMapper.

Get in touch

Security and Support

For any security-related issues in the ThreatMapper project, contact productsecurity at deepfence dot io.

Please file GitHub issues as needed, and join the Deepfence Community Slack channel.

License

The Deepfence ThreatMapper project (this repository) is offered under the Apache2 license.

Contributions to Deepfence ThreatMapper project are similarly accepted under the Apache2 license, as per GitHub's inbound=outbound policy.

Comments
  • Scans failing to pick up RedHat RPMs

    Scans failing to pick up RedHat RPMs

    Describe the bug I'm scanning RH 7.7 machines with the Bare-Metal / Docker container configuration. I get results back for application code Java, Python, etc. But nothing about the RPMs and packages installed.

    To Reproduce Steps to reproduce the behavior:

    1. Install RH 7.7 - Might be tricky to find the ISO....

    2. Docker Won't install on RH 7.7 so you'll need to add some Centos packages sudo yum -y install http://mirror.centos.org/centos/7/extras/x86_64/Packages/container-selinux-2.107-3.el7.noarch.rpm --nogpgcheck sudo yum -y install http://mirror.centos.org/centos/7/extras/x86_64/Packages/slirp4netns-0.4.3-4.el7_8.x86_64.rpm --nogpgcheck sudo yum -y install http://mirror.centos.org/centos/7/extras/x86_64/Packages/fuse3-libs-3.6.1-4.el7.x86_64.rpm --nogpgcheck sudo yum -y install http://mirror.centos.org/centos/7/extras/x86_64/Packages/fuse-overlayfs-0.7.2-6.el7_8.x86_64.rpm --nogpgcheck sudo yum -y install docker-ce docker-ce-cli containerd.io

    3. Then start docker and run the Sensor Agent as per the documentation.

    4. Run a scan with all options enabled.

    Expected behavior I'd expect to see details of the RPMs with CVEs that need updating.

    Components/Services affected

    • [ ] UI/Frontend
    • [ ] API/Backend
    • [ X] Agent
    • [ ] Deployment/YAMLs
    • [ ] CI/CD Integration
    • [ ] Other (specify)

    Additional context Both the Agent and Management Console are running as virtual machines (Oracle Virtual Box) on my laptop. I wanted to do a scan of RH 7.7 before updating to RH 7.9 to see how many CVEs get fixed, and how many remain.

  • Unable to navigate from 'Topology'

    Unable to navigate from 'Topology'

    Hi,

    I've setup the management console on an AWS instance using the repository instructions. I've registered an account and accessed the console but I can't navigate to any other pages (registries, vulnerabilities, settings etc.). It seems to be in a loop of 'resuming the live state' and is stuck 'Optimizing hosts'.

    I've given it over 60 minutes as the readme mentioned, but there's been no change.

    I can't find any obvious problems looking through the various container logs. I wondered if someone here could offer any guidance?

  • deepfence_agent_ce:latest on armv7 docker

    deepfence_agent_ce:latest on armv7 docker

    Maybe this isn't really a bug, but maybe an configuration or compatibility issue. The sensor must be install on external chip set devices they are in a network comparison. Basic for this is armV7.

    The package installation in dependencies was installing docker.io on armv7. Which image or where can find the armV7 deploy image for ?

    1. try to deploy the deepfence_agent_ce:latest on armv7 with following script
    2. See error

    docker run -dit --cpus=".2" --name=deepfence-agent --restart on-failure --pid=host --net=host \ --privileged=true -v /sys/kernel/debug:/sys/kernel/debug:rw -v /var/log/fenced \ -v /var/run/docker.sock:/var/run/docker.sock -v /:/fenced/mnt/host/:ro \ -e USER_DEFINED_TAGS="" -e MGMT_CONSOLE_URL="XXX.XXX.XXX.XXX" -e MGMT_CONSOLE_PORT="443" \ -e DEEPFENCE_KEY="API-KEY" \ deepfenceio/deepfence_agent_ce:latest Result: WARNING: The requested image's platform (linux/amd64) does not match the detected host platform (linux/arm/v7) and no specific platform was requested Components/Services affected

    • [ ] UI/Frontend
    • [ ] API/Backend
    • [x] Agent
    • [ ] Deployment/YAMLs
    • [ ] CI/CD Integration
    • [ ] Other (specify)
  • Docker Issue : deepfenceio/deepfence_init_ce:1.4.1 Exit Errror

    Docker Issue : deepfenceio/deepfence_init_ce:1.4.1 Exit Errror

    Dear team,

    I would like to ask you about the following error I have.

    The error happens after a zero installation by downloading the docker-compose file and running it.

    I only modify in it the default port since I have in use the 443, but after that everything is the same.

    The docker runs correctly but when I try to enter the port I get the following message in the browser: "secure connection failed" "PR_END_OF_FILE_ERRROR".

    It doesn't seem to be a browser problem since I validated it with several ...

    I run the command docker ps -a and I see that there is an instance with an error.

    Error :

    5f182a2d1de5 deepfenceio/deepfence_init_ce:1.4.1 "/usr/local/bin/entr…" 2 hours ago Exited (0) 2 seconds ago df-init-container

    I really don't know what I could do... the instance has the capability to support docker and is on AWS EC2 which I understand is compatible with this solution.

    thanks,

  • Upload Vulnerabilty Database Issue

    Upload Vulnerabilty Database Issue

    Describe the bug: Cannot upload the vulnerability database.

    To Reproduce: Steps to reproduce the behavior:

    1. Go to Settings > Vulnerability & Secret Management
    2. Upload the vulnerability database with tar.gz file
    3. Check Network tab on browser, it shows POST 404 Not Found with this URL: https://address/undefined/df-api/upload-vulnerability-db

    Screenshots: Screenshot 2022-09-13 091852

    Additional context: Deepfence: 1.4.0

  • Threat Mapper Management Console does not show up when running on local server

    Threat Mapper Management Console does not show up when running on local server

    Describe the bug Threat mapper downloaded from git URL, performed steps to run management console on local server but console does not show up on the local IP address and given PORT.

    To Reproduce Steps to reproduce the behavior:

    1. Go to 'https://github.com/deepfence/ThreatMapper'
    2. Clone the repo.
    3. Follow steps give on: https://github.com/deepfence/ThreatMapper/wiki/Building-Console-and-Sensors-from-Source to run Threat Mapper Management Console on local server.
    4. Check if Threat Mapper Management Console came up on given IP and PORT.

    Expected behavior Threat Mapper Management Console should come up on given IP and PORT.

    Screenshots Attaching a PDF in comments section for detailed explanation and to show successful configuration steps.

    Components/Services affected

    Additional context OS Details: Ubuntu 20.04.4 LTS (64-bit) CPU/RAM/SSD: Intel Core i7 / 32 GB RAM / 512 GB SSD

  • Issue scanning Management node and registries

    Issue scanning Management node and registries

    Unable to run vulnerability scans on management console node and registries. Vulnerability scans start but hang after a while with error "Scan was interrupted". There is no info in the docker-compose logs to investigate or viewable logs from the console itself.

  • PDF report always shows

    PDF report always shows "No vulnerabilities found for the applied filters"

    Thanks for providing this tool!

    Describe the bug When trying to generate a PDF report with vulnerabilities a PDF with the text "No vulnerabilities found for the applied filters" is always generated. Switching to the XLSX format returns thousands.

    To Reproduce Steps to reproduce the behavior:

    1. Go to 'Integrations > Reports / PDF/XLSX'
    2. Select 'Vulnerabilities', 'container image', 'last 1 day' and PDF format.
    3. Click Download.
    4. Wait until report is generated and download it (a file without vulnerabilities is generated).
    5. Switch to XLSX download type and click Download.
    6. A XLSX file with thousand of vulnerabilities is shown.

    Expected behavior I expected that the only difference would be the file format. The list of vulnerabilities should be the same.

    Screenshots Filter settings and "Filters used" - Note the differences here. image

    Extract from XLSX: image

    PDF file downloaded: image

    Components/Services affected

    Making a best effort guess here.

    • [X] UI/Frontend
    • [X] API/Backend
    • [ ] Agent
    • [ ] Deployment/YAMLs
    • [ ] CI/CD Integration
    • [ ] Other (specify)

    I hope the above helps with tracking down the issue. Since the Filters Used are different depending on file format, I suspect the issue might lay there.

    Thanks

  • Error when register: Console URL is not valid

    Error when register: Console URL is not valid

    Describe the bug I started with the getting started page with docker-compose. After starting the services, I can enter the portal and click on "Register". After I filled the form, I got the error "Console URL is not valid"

    To Reproduce Steps to reproduce the behavior:

    1. Go to this page: https://github.com/deepfence/ThreatMapper/wiki/Installing-the-Management-Console
    2. Follow instruction in section: "Install the ThreatMapper Management Console - Single Docker Host"
    3. Go to web-portal "https://localhost/"
    4. Click on register
    5. Enter your details
    6. Click on button to submit form
    7. Got the error "Console URL is not valid"

    Expected behavior Registration should be successfull to be able to login into the web-ui.

    Screenshots image

    Components/Services affected

    • [X] UI/Frontend
    • [X] API/Backend
    • [ ] Agent
    • [ ] Deployment/YAMLs
    • [ ] CI/CD Integration
    • [ ] Other (specify)

    Additional context None

  • Installation of Management Console Fails

    Installation of Management Console Fails

    Provided the docer-compose.yml file, when executing the following command:

    docker-compose -f docker-compose.yml up -d

    I am unable to browse to the management console as not all containers are started, specifically the deepfence-es-master container which presents the following errors:

    Exception in thread "main" java.lang.RuntimeException: starting java failed with [137]
    output:
    
    error:
    OpenJDK 64-Bit Server VM warning: Option UseConcMarkSweepGC was deprecated in version 9.0 and will likely be removed in a future release.
    	at org.elasticsearch.tools.launchers.JvmErgonomics.flagsFinal(JvmErgonomics.java:123)
    	at org.elasticsearch.tools.launchers.JvmErgonomics.finalJvmOptions(JvmErgonomics.java:88)
    	at org.elasticsearch.tools.launchers.JvmErgonomics.choose(JvmErgonomics.java:59)
    	at org.elasticsearch.tools.launchers.JvmOptionsParser.main(JvmOptionsParser.java:95)
    

    Would appreciate any guidance.

  • [K8s console] [vulnerability scan] scan failures

    [K8s console] [vulnerability scan] scan failures

    1. Setup a K8s cluster. Install management console on it.
    2. Connect a regular vm agent. In this setup there is just one fsharp docker container running on the vm.
    3. Scan both the fsharp container and the vm. Both scans run forever. image
  • [Graph integration] Add new deepfence CLI

    [Graph integration] Add new deepfence CLI

    As part of the ongoing effort to integrate with neo4j graph (https://github.com/deepfence/ThreatMapper/issues/692) we are adding a new CLI to allow headless interaction with the console.

    • [x] Topology API
    • [x] Threat API
    • [x] Authentication
    • [x] User API
      • [ ] Login API
      • [x] APIToken
      • [x] Register
    • [x] Scan API
      • [x] Secret scan
      • [ ] Compliance scan
      • [ ] Malware scan
      • [ ] Cloud scan
    • [ ] Ingesters API
  • Vulnerability and Secret scans - show differences between scan results for a host/image in UI

    Vulnerability and Secret scans - show differences between scan results for a host/image in UI

    • We currently provide an API that helps diffing (new vulnerabilities, fixed vulnerabilities, etc) between any two given scan IDs on any node (container images or a host). This feature should be provided in UI.
    • API exists for vulnerability scan, required for secret scan
    • https://deepfence.github.io/deepfence_runtime_api/#operation--deepfence-v1.5-vulnerability_scan_diff-get
  • Kubernetes Sensor Agents do not run on ARM nodes

    Kubernetes Sensor Agents do not run on ARM nodes

    Describe the bug When the kubernetes sensor agent pods run on ARM64 (graviton2) worker nodes they crash with this error: exec /usr/local/bin/start_services: exec format error

    To Reproduce Steps to reproduce the behavior:

    1. Deploy https://github.com/deepfence/ThreatMapper/tree/master/deployment-scripts/helm-charts/deepfence-agent to a k8s cluster that is running ARM worker nodes.
    2. Pods from the daemonset that try to run on ARM nodes error out: exec /usr/local/bin/start_services: exec format error
    • [ ] UI/Frontend
    • [ ] API/Backend
    • [x] Agent
    • [ ] Deployment/YAMLs
    • [ ] CI/CD Integration
    • [ ] Other (specify)
  • [Graph integration] Improvement unified package-scanner code

    [Graph integration] Improvement unified package-scanner code

    merge vulnerability mapper from ThreatMapper to package-scanner making it easier to run vulnerability scans using syft and grype from a single place

    add option to run only sbom generation(syft) on agent and run grype on threatmapper console using command line flags

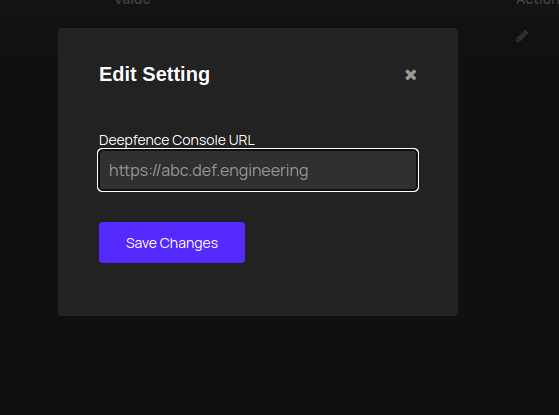
  • Unable to change the Deepfence console url as my top level domain is engineering

    Unable to change the Deepfence console url as my top level domain is engineering

    Describe the bug My top level domain is engineering ex; xxx.xxx.engineering since engineering is a large alphabet, the console URL is not accepting it

    image

  • Missing 'Severity' filter in notification for vulnerabilities

    Missing 'Severity' filter in notification for vulnerabilities

    Describe the bug Earlier we used to have a filter called 'severity' in notification, which helped to filter only selected severity vuln. to be pushed as notification to slack, teams, etc. It's not present now.

    Screenshots image

    Components/Services affected

    • [x] UI/Frontend
    • [ ] API/Backend
    • [ ] Agent
    • [ ] Deployment/YAMLs
    • [ ] CI/CD Integration
    • [ ] Other (specify)

    Additional context Add any other context about the problem here.

Open Source runtime scanner for Linux containers (LXD), It performs security audit checks based on CIS Linux containers Benchmark specification
Open Source runtime scanner for Linux containers (LXD), It performs security audit checks based on CIS Linux containers  Benchmark specification

lxd-probe Scan your Linux container runtime !! Lxd-Probe is an open source audit scanner who perform audit check on a linux container manager and outp

Dec 26, 2022
Open Service Mesh (OSM) is a lightweight, extensible, cloud native service mesh that allows users to uniformly manage, secure, and get out-of-the-box observability features for highly dynamic microservice environments.

Open Service Mesh (OSM) Open Service Mesh (OSM) is a lightweight, extensible, Cloud Native service mesh that allows users to uniformly manage, secure,

Jan 2, 2023
ip-masq-agent-v2 aims to solve more specific networking cases, allow for more configuration options, and improve observability compared to the original.

ip-masq-agent-v2 Based on the original ip-masq-agent, v2 aims to solve more specific networking cases, allow for more configuration options, and impro

Aug 31, 2022
provide api for cloud service like aliyun, aws, google cloud, tencent cloud, huawei cloud and so on

cloud-fitter 云适配 Communicate with public and private clouds conveniently by a set of apis. 用一套接口,便捷地访问各类公有云和私有云 对接计划 内部筹备中,后续开放,有需求欢迎联系。 开发者社区 开发者社区文档

Dec 20, 2022
The open source public cloud platform. An AWS alternative for the next generation of developers.

M3O M3O is an open source public cloud platform. We are building an AWS alternative for the next generation of developers. Overview AWS was a first ge

Jan 2, 2023
Hubble - Network, Service & Security Observability for Kubernetes using eBPF

Network, Service & Security Observability for Kubernetes What is Hubble? Getting Started Features Service Dependency Graph Metrics & Monitoring Flow V

Jan 2, 2023
K8s controller implementing Multi-Cluster Services API based on AWS Cloud Map.

AWS Cloud Map MCS Controller for K8s Introduction AWS Cloud Map multi-cluster service discovery for Kubernetes (K8s) is a controller that implements e

Dec 17, 2022
Vilicus is an open source tool that orchestrates security scans of container images(docker/oci) and centralizes all results into a database for further analysis and metrics.

Vilicus Table of Contents Overview How does it work? Architecture Development Run deployment manually Usage Example of analysis Overview Vilicus is an

Dec 6, 2022
Open Source runtime scanner for OpenShift cluster and perform security audit checks based on CIS RedHat OpenShift Benchmark specification

OpenShift-Ordeal Scan your Openshift cluster !! OpenShift-Ordeal is an open source audit scanner who perform audit check on OpenShift Cluster and outp

Sep 6, 2022
Cloud-on-k8s- - Elastic Cloud on Kubernetes (ECK)

Elastic Cloud on Kubernetes (ECK) Elastic Cloud on Kubernetes automates the depl

Jan 29, 2022
Write controller-runtime based k8s controllers that read/write to git, not k8s

Git Backed Controller The basic idea is to write a k8s controller that runs against git and not k8s apiserver. So the controller is reading and writin

Dec 10, 2021
K8s-cinder-csi-plugin - K8s Pod Use Openstack Cinder Volume

k8s-cinder-csi-plugin K8s Pod Use Openstack Cinder Volume openstack volume list

Jul 18, 2022
K8s-ingress-health-bot - A K8s Ingress Health Bot is a lightweight application to check the health of the ingress endpoints for a given kubernetes namespace.

k8s-ingress-health-bot A K8s Ingress Health Bot is a lightweight application to check the health of qualified ingress endpoints for a given kubernetes

Jan 2, 2022
K8s-go-structs - All k8s API Go structs

k8s-api go types Why? Its nice to have it all in a single package. . |-- pkg |

Jul 17, 2022
Planet Scale Robotics - Offload computation-heavy robotic operations to GPU powered world's first cloud-native robotics platform.

robolaunch ?? Planet Scale Robotics - Offload computation-heavy robotic operations to GPU powered world's first cloud-native robotics platform. robola

Jan 1, 2023
Cloud-Z gathers information and perform benchmarks on cloud instances in multiple cloud providers.

Cloud-Z Cloud-Z gathers information and perform benchmarks on cloud instances in multiple cloud providers. Cloud type, instance id, and type CPU infor

Jun 8, 2022
Hexa is the open-source, standards-based policy orchestration software for multi-cloud and hybrid businesses.

Hexa Policy Orchestrator Hexa is the open-source, standards-based policy orchestration software for multi-cloud and hybrid businesses. The Hexa projec

Dec 22, 2022
TriggerMesh open source event-driven integration platform powered by Kubernetes and Knative.

TriggerMesh open source event-driven integration platform powered by Kubernetes and Knative. TriggerMesh allows you to declaratively define event flows between sources and targets as well as add even filter, splitting and processing using functions.

Dec 30, 2022