Delve is a debugger for the Go programming language.

Delve

license GoDoc Build Status

The GitHub issue tracker is for bugs only. Please use the developer mailing list for any feature proposals and discussions.

About Delve

Delve is a debugger for the Go programming language. The goal of the project is to provide a simple, full featured debugging tool for Go. Delve should be easy to invoke and easy to use. Chances are if you're using a debugger, things aren't going your way. With that in mind, Delve should stay out of your way as much as possible.

Comments
  • WIP: Refactor to HTTP client/server model

    WIP: Refactor to HTTP client/server model

    NOTE This is a work-in-progress, and the PR is to facilitate ongoing design discussion. This PR is intended to address #22.

    Goals

    1. Introduce an HTTP server using net.Listener to provide a JSON-based remote API to the debugger
      1. Support RESTful operations for state retrieval and commands
      2. Support a long-polling watch requests to support event notifications
    2. Provide a Go client interface and default HTTP implementation
    3. Refactor the terminal to be a pure API client consumer

    The original PR is based on this comment on #22.

  • OS X: cannot get thread count

    OS X: cannot get thread count

    Please answer the following before submitting your issue:

    Note: Please include any substantial examples (debug session output, stacktraces, etc) as linked gists.

    1. What version of Delve are you using (dlv version)? Delve Debugger Version: 0.11.0-alpha Build: fb8388ab2e50ca28ef9a83c73c329f8d0b6234d9

    2. What version of Go are you using? (go version)? go version go1.7.1 darwin/amd64

    3. What operating system and processor architecture are you using? OS X 10.12.1 Beta (16B2333a) (developer beta 2 Sept 28)

    4. What did you do? Tried to debug my app from within Visual Studio Code and from the command line with the same results

    5. What did you expect to see? Debugging goodness

    6. What did you see instead? From VS Code: 2016/09/29 06:26:35 server.go:71: Using API v1 2016/09/29 06:26:35 debugger.go:61: launching process with args: [./debug -race -tags debug] could not launch process: could not get thread count

      From terminal: joefrancia@iMac [6:17:20]: dlv debug could not launch process: could not get thread count

    I believe it may be related to the upgrade from Sierra beta 1 to beta 2. I was debuggin a'plenty earlier in the afternoon on my MacBook which was still on beta 1, but when I tried on the iMac I got the above failure. The iMac is beta 2. I've since upgraded the MacBook to beta 2 (this was before I realized there may be a problem) and now I get the same error on the MacBook.

  • could not launch process: EOF

    could not launch process: EOF

    Please answer the following before submitting your issue:

    Note: Please include any substantial examples (debug session output, stacktraces, etc) as linked gists.

    1. What version of Delve are you using (dlv version)?
    Delve Debugger
    Version: 1.0.0
    Build: db435c184eb79976087fc0cb36c2867c737a9066
    
    1. What version of Go are you using? (go version)?
    go env
    GOARCH="amd64"
    GOBIN=""
    GOCACHE="/Users/dingwenjiang/Library/Caches/go-build"
    GOEXE=""
    GOHOSTARCH="amd64"
    GOHOSTOS="darwin"
    GOOS="darwin"
    GOPATH="/Users/dingwenjiang/go"
    GORACE=""
    GOROOT="/usr/local/go"
    GOTMPDIR=""
    GOTOOLDIR="/usr/local/go/pkg/tool/darwin_amd64"
    GCCGO="gccgo"
    CC="clang"
    CXX="clang++"
    CGO_ENABLED="1"
    CGO_CFLAGS="-g -O2"
    CGO_CPPFLAGS=""
    CGO_CXXFLAGS="-g -O2"
    CGO_FFLAGS="-g -O2"
    CGO_LDFLAGS="-g -O2"
    PKG_CONFIG="pkg-config"
    GOGCCFLAGS="-fPIC -m64 -pthread -fno-caret-diagnostics -Qunused-arguments -fmessage-length=0 -fdebug-prefix-map=/var/folders/ly/7p11f6gn5v71sspkdwx4qhgc0000gn/T/go-build573955664=/tmp/go-build -gno-record-gcc-switches -fno-common"
    
    1. What operating system and processor architecture are you using?
    sw_vers
    ProductName:	Mac OS X
    ProductVersion:	10.13.4
    BuildVersion:	17E199
    
    
    uname -a
    Darwin dingwenjiangdeMacBook-Pro.local 17.5.0 Darwin Kernel Version 17.5.0: Mon Mar  5 22:24:32 PST 2018; root:xnu-4570.51.1~1/RELEASE_X86_64 x86_64
    
    1. What did you do?
    go get -u github.com/derekparker/delve/cmd/dlv
    go build -gcflags "-N -l" -a github.com/golang/example/hello
    $GOPATH/bin/dlv exec hello
    could not launch process: EOF
    
    1. What did you expect to see?
    To dlv start a debug session
    
    1. What did you see instead?
    could not launch process: EOF
    
  • dlv exec throws

    dlv exec throws "could not launch process: EOF"

    Please answer the following before submitting your issue:

    Note: Please include any substantial examples (debug session output, stacktraces, etc) as linked gists.

    1. What version of Delve are you using (dlv version)?
    Delve Debugger
    Version: 1.0.0-rc.2
    Build: $Id: 5c7676404d10d52e16be57fea744a7312b831f0c $
    
    1. What version of Go are you using? (go version)?
    go env
    GOARCH="amd64"
    GOBIN=""
    GOEXE=""
    GOHOSTARCH="amd64"
    GOHOSTOS="darwin"
    GOOS="darwin"
    GOPATH="/Users/pablo.molnar"
    GORACE=""
    GOROOT="/usr/local/Cellar/go/1.9.2/libexec"
    GOTOOLDIR="/usr/local/Cellar/go/1.9.2/libexec/pkg/tool/darwin_amd64"
    GCCGO="gccgo"
    CC="clang"
    GOGCCFLAGS="-fPIC -m64 -pthread -fno-caret-diagnostics -Qunused-arguments -fmessage-length=0 -fdebug-prefix-map=/var/folders/v9/yp3rfr6n41lgnfl0g6c4wxqw385cfp/T/go-build535672296=/tmp/go-build -gno-record-gcc-switches -fno-common"
    CXX="clang++"
    CGO_ENABLED="1"
    CGO_CFLAGS="-g -O2"
    CGO_CPPFLAGS=""
    CGO_CXXFLAGS="-g -O2"
    CGO_FFLAGS="-g -O2"
    CGO_LDFLAGS="-g -O2"
    PKG_CONFIG="pkg-config"
    
    1. What operating system and processor architecture are you using?
    sw_vers
    ProductName:	Mac OS X
    ProductVersion:	10.13.1
    BuildVersion:	17B48
    
    uname -a
    Darwin MACC02TX14FHTDD 17.2.0 Darwin Kernel Version 17.2.0: Fri Sep 29 18:27:05 PDT 2017; root:xnu-4570.20.62~3/RELEASE_X86_64 x86_64
    
    1. What did you do?
    go get -u github.com/derekparker/delve/cmd/dlv
    go build -gcflags "-N -l" -a github.com/golang/example/hello
    $GOPATH/bin/dlv exec hello
    could not launch process: EOF
    
    1. What did you expect to see? To dlv start a debug session

    2. What did you see instead? could not launch process: EOF

    This is a new MacBook Pro (MacBookPro14,3) with all the updates. Old MacBook Pro (MacBookPro11,5) with all updates works fine... Not working through the terminal nor IntelliJ IDEA Go plugin

  • could not launch process: decoding dwarf section info at offset 0x0: too short

    could not launch process: decoding dwarf section info at offset 0x0: too short

    When I brew install go ,and go get -u -v github.com/derekparker/delve/cmd/dlv , I debug the program, it throw Exception as following (while it is ok when I run the program, ): GOROOT=/usr/local/Cellar/go/1.10/libexec #gosetup GOPATH=/Users/friends/Documents/VirtualMachine/share/gopath #gosetup /usr/local/Cellar/go/1.10/libexec/bin/go build -gcflags "-N -l" -tags nopkcs11 "-ldflags=-linkmode internal" -o /private/var/folders/cg/mwzlhrjs5y55ny553g6xz9tr0000gn/T/___peer_server -gcflags "all=-N -l" /Users/friends/Documents/VirtualMachine/share/gopath/src/github.com/hyperledger/fabric/peer/main.go #gosetup "/Applications/GoLand 1.0 EAP.app/Contents/plugins/intellij-go-plugin/lib/dlv/mac/dlv" --listen=localhost:50170 --headless=true --api-version=2 --backend=native exec /private/var/folders/cg/mwzlhrjs5y55ny553g6xz9tr0000gn/T/___peer_server -- node start --peer-chaincodedev=true -orderer 192.168.120.189:7050 #gosetup could not launch process: decoding dwarf section info at offset 0x0: too short

    Delve Debugger Version: 1.0.0 Build: $Id: c98a142125d0b17bb11ec0513bde346229b5f533 $

    go version go1.10 darwin/amd64

    MacOS Darwin

  • [WIP] Windows support

    [WIP] Windows support

    Initial work on porting Delve to support Windows.

    There's a lot more to do before this is ready to be merged, but most of the core infrastructure for Windows support is in place, and some basic Delve scenarios are working in simple scenarios (launching, setting breakpoints, continuing, breaking on breakpoints, inspecting registers, seeing sources, inspecting locals, exiting, etc.).

    Fixes #198.

  • FreeBSD initial support

    FreeBSD initial support

    This pull request adds initial support for FreeBSD. It's primarily based on fbsd branch from: github.com:asomers/delve.git, just fixes few critical bugs and adds few new functions.

    It passes almost all tests (281 of 288), except few "Concurrency" ones, but I believe it's not a bug, but a natural behavior for FreeBSD and these tests should be slightly changed.

    E.g. on "TestBreakpointCounts" two threads are expected to hit same breakpoint 100 times each. In FreeBSD, when main thread exits, all "child" threads are not triggering TRAP signals anymore, process just finishes. That's why when main thread reaches 100 breakpoint hits and exits, child thread will never reach 100 and stops somewhere around 95. Sometimes, when child thread is faster and completes BP race first, we can see this test as PASSED.

    Other than that it works fine.

    ref: https://github.com/go-delve/delve/issues/213

    Thanks.

  • Support for OSX

    Support for OSX

    Thanks for working on this!

    I just wanted to try it out, but it seems like OSX is not supported yet?

    $ go get -u github.com/derekparker/delve/cmd/dlv
    go build github.com/derekparker/delve/proctl: no buildable Go source files in /Users/felix/code/go/src/github.com/derekparker/delve/proctl
    # github.com/derekparker/delve/goreadline
    38: error: use of undeclared identifier 'rl_catch_sigwinch'
    38: error: use of undeclared identifier 'rl_resize_terminal'; did you mean 'rl_reset_terminal'?
    
  • proc.(*Process).Continue skips breakpoints [WIP]

    proc.(*Process).Continue skips breakpoints [WIP]

    This is a fix for the problem unearthed by PR #255, it is submitted for discussion, not definitive.

    There are two problems with (*Process).Continue

    1. The first is that between the time one breakpoint is triggered and the point where we loop over all threads and Halt eacho one the second goroutine may hit the breakpoint too, this second hit gets lost
    2. The second problem is that the way Continue resumes the process has a race condition with the tracee

    Let's that thread A hit the breakpoint and thread B was sleeping when Continue called Halt on it. After we finish processing the breakpoint on A we call Continue again, Continue then loops through all threads, it calls resume on B, then moves onto thread A, sees that it's on a breakpoint so it calls (*Thread).Step(). If thread B happens to get to the breakpoint while (*Thread).Step on thread A is happening the breakpoint gets skipped, because we temporarily cleared it.

    You can test this by reverting the changes and running TestBreakpointCounts. The fact that multiple breakpoints can be hit simultaneously needs to be propagated all the way to the client, either by changing CurrentBreakpoint in State to a slice or by returning one breakpoint at a time in Debugger.

  • service/dap: Support for replay and core modes

    service/dap: Support for replay and core modes

    This PR aims to add support for rr replay and core actions from the DAP layer. This basically encloses the following:

    New launch modes: replay and core

    The following modes are added:

    • replay: Replays an rr trace, allowing backwards flows (reverse continue and stepback). Requires a traceDirPath property on launch.json pointing to a valid rr trace directory. Equivalent to dlv replay <tracedir> command.
    • core: Replays a core dump file, showing its callstack and the file matching the callsite. Requires a coreFilePath property on launch.json pointing to a valid coredump file. Equivalent to dlv core <exe> <corefile> command.

    Dependencies

    To achieve this the following additional changes were made:

    • Implement the onStepBackRequest and onReverseContinueRequest methods on service/dap
    • Adapt onLaunchRequest with the requried validations and logic for these new modes
    • Use CapabilitiesEvent responses to enable the StepBack controls on the supported scenarios (see dicussion here)
    • Add the corresponding launch.json support on vs code: https://github.com/golang/vscode-go/pull/1268
  • IDE interfaces

    IDE interfaces

    Hi @derekparker,

    First of all, Thank you for this!

    While I haven't played with it yet, I plan to do so this weekend.

    If all things work good enough, I'd be interesting in integrating it with the Go plugin for IntelliJ IDEA.

    As I haven't seen anything that could help out IDEs do the interfacing part so I'd like to ask if there's any plans for this. I could potentially help out by defining an HTTP interface for it and just pipe all the commands to the debugger via HTTP calls / JSON responses. A side effect of this, then it could allow creating web interfaces for this.

    What do you think? Does it make sense to you? If you'd like to chat, please drop me a mention on Gitter.

    Kind regards

  • breakpoint not hit and missing stack frames from runtime

    breakpoint not hit and missing stack frames from runtime

    I'm seeing two different behaviors that seem bugs (I don't know if bugs in Delve or faulty debug info); they're both around the same runtime function, so I'm reporting both of them here and I'll let someone else split them in different issues if they are indeed different.

    Problem 1: placing a breakpoint by line number in traceback.go:457 (this line) doesn't work. The breakpoint is never hit. The pc at which Delve places the breakpoint is jumped over in some executions. Placing the breakpoint by hand at different pc's associated with the same source line works.

    Repro: Consider the following program:

    package main
    
    import (
    	"net/http"
    	_ "net/http/pprof" // For the pprof http handler
    )
    
    func main() {
    	http.ListenAndServe("localhost:8080", nil)
    }
    

    Compile it with go 1.19.4 (default gcflags, optimizations enabled), on Linux, and then

    $ dlv attach `pidof repro`
    
    (dlv) break traceback.go:457
    Breakpoint 1 set at 0x45f260 for runtime.gentraceback() /home/andrei/goroot/src/runtime/traceback.go:457
    

    Notice the 0x45f260. A reference from objdump --dwarf=decodedline testprog | grep 'traceback.go.':

    traceback.go                                 457            0x45f1d9        
    traceback.go                                 453            0x45f1e6               x
    traceback.go                                 453            0x45f1eb        
    traceback.go                                 453            0x45f200               x
    traceback.go                                 453            0x45f205        
    traceback.go                                 454            0x45f219               x
    traceback.go                                 454            0x45f21e        
    traceback.go                                 457            0x45f260               x
    traceback.go                                 457            0x45f262        
    traceback.go                                 457            0x45f26a               x
    traceback.go                                 457            0x45f26f        
    traceback.go                                 457            0x45f277               x
    traceback.go                                 457            0x45f27c        
    

    0x45f260 is not the first PC associated with line 457, but seems to be the first pc that is marked as Stmt (in case that's relevant). Now exercise the code through the pprof endpoint, for example through:

    http://localhost:8080/debug/pprof/goroutine?debug=2
    

    Our breakpoint is in a helper function around printing the goroutine dump, and it should be hit. However, you'll see that it is not hit. If we place our breakpoint slightly earlier in this function, we can trace and see how the PC progresses:

    (dlv) break traceback.go:454
    Breakpoint 2 set at 0x45f219 for runtime.gentraceback() /home/andrei/goroot/src/runtime/traceback.go:454
    (dlv) c
    > runtime.gentraceback() /home/andrei/goroot/src/runtime/traceback.go:454 (hits goroutine(12):1 total:1) (PC: 0x45f219)
    si
    si
    ...
    

    The PC goes:

    0x45f219
    0x45f21e
    0x45f220
    0x45f224 -> The instruction here is jnz 0x45f262
    0x45f262 -> So we jumped over 0x45f260
    0x45f26a  -> This is where an `n` brings me, probably because this instruction is the next one marked as `Stmt`.
    

    So, it seems to me that the pc 0x45f260 is the wrong one to put the breakpoint in; some code paths jump over it.


    Problem 2: Delve seems to not generate a correct backtrace when starting from inside this runtime.genbacktrace() function. If you do bt from the pc's referenced above, you get the following. Stack frames are missing between the runtime.gentraceback and the runtime.systemstack_switch frames: there's supposed to be a couple of functions in there. By poking around with other tools, the stack unwinding debug info seems to exist, and to be correct for the gentraceback locations. But don't take my word for it.

    0  0x000000000045f26a in runtime.gentraceback
        at /home/andrei/goroot/src/runtime/traceback.go:457
     1  0x0000000000469020 in runtime.systemstack_switch
        at /home/andrei/goroot/src/runtime/asm_amd64.s:459
     2  0x00000000004313af in runtime.Stack
        at /home/andrei/goroot/src/runtime/mprof.go:1203
     3  0x0000000000661a90 in runtime/pprof.writeGoroutineStacks
        at /home/andrei/goroot/src/runtime/pprof/pprof.go:692
     4  0x00000000006619cb in runtime/pprof.writeGoroutine
        at /home/andrei/goroot/src/runtime/pprof/pprof.go:681
     5  0x000000000065e94b in runtime/pprof.(*Profile).WriteTo
        at /home/andrei/goroot/src/runtime/pprof/pprof.go:330
     6  0x000000000066db25 in net/http/pprof.handler.ServeHTTP
        at /home/andrei/goroot/src/net/http/pprof/pprof.go:253
    ...
    
  • cmd/dlv: match go test behavior when dlv test gets a list of .go files

    cmd/dlv: match go test behavior when dlv test gets a list of .go files

    When 'dlv test' is called with a list of files it should match the behavior of 'go test' and chdir to the directory where the go files are (if they are all in the same directory).

    Fixes #3230

  • BUG: Delve runs tests using wrong working directory

    BUG: Delve runs tests using wrong working directory

    Please answer the following before submitting your issue:

    1. What version of Delve are you using (dlv version)? 1.9.1
    2. What version of Go are you using? (go version)? 1.19.4 darwin/arm64
    3. What operating system and processor architecture are you using? MacOS Ventura arm64
    4. What did you do? dlv est reader/*.go -test.v, test case prints result of os.Getwd()
    5. What did you expect to see? package directory
    6. What did you see instead? CWD were delve was executed

    When go test runs a test case, it performs a chdir into the package directory before executing the test. The dlv test command does not perform the same chdir, instead executing from the current directory from which dlv test was executed.

    This makes it difficult for test cases to open input files for use in testing, because there is no path to the input file that works in both cases.

    There are two workarounds:

    1. CWD to the package directory before running dlv
    2. Use a clever hack exploiting runtime.Caller(0) described here. Apparently the issue came up in Intellij as well.

    The hack approach relies on knowing the relative path relationship between a special package and the project root, and uses this to chdir to the project root in both dlv test and go test. This isn't a great resolution, but at least it offers consistency.

    My general sense is that dlv test should be replicating the environment provided by go test as exactly as (reasonably) possible.

  • proc: populate pointer values

    proc: populate pointer values

    Before this patch, Variables of kind reflect.Ptr did not have their Value field populated. This patch populates it in Variable.loadValue(), which seems natural and consistent with other types of variables. The Value is the address that the pointer points to.

    This change is not very consequential; code generally uses pointer variables through maybeDereference(), which reads the pointer value ephemerally and dereferences it. Also, as far as I can tell, the API does not permit asking for a pointer's value because LoadConfig.FollowPointers is always set; the user can't control it. Still, I have needed this while hacking on Delve, and it seemed like a good thing to do. I have attempted to unify the reading of the pointer value done by maybeDereference() with the one now being done in loadValue(), but I ran into issues because maybeDereference() is used not only on pointers, but also on channels - so maybeDereference() can't assume the Value field to be the pointed-to address. I can try harder to unify/refactor if need be.

  • killing delve started with `trace --ebpf` does not kill the debugged program

    killing delve started with `trace --ebpf` does not kill the debugged program

    When using dlv trace --ebpf and then ctrl-C'ing dlv, dlv exits but the inferior survives. This is in contrast to dlv trace --ebpf=false, where killing dlv also kills the inferior. I assumed killing it is the desired behavior.

    I'm using Delve from today's master at 72c77b1c30fccead4c8d03e9bb9fbe071c156a.

Rdebug — Real Debugger

RDebug - Real Debugger Translation 中文 1. Introduction Rdebug is an open source tool chain that focusing on efficiency of daily developing, testing and

Dec 23, 2022
Learngo - The purpose of this repository is to teach the basics of go programming language.

Learn Go Programming The purpose of this repository is to teach the basics of go programming language. Go programming language is developed and active

Jan 3, 2022
Colored pretty printer for Go language

pp Colored pretty printer for Go language Usage Just call pp.Print(). import "github.com/k0kubun/pp" m := map[string]string{"foo": "bar", "hello": "w

Dec 29, 2022
groqfmt is a formatter for the GROQ query language

groqfmt groqfmt is a formatter for the GROQ query language. Usage Either: groqfmt INPUT > OUTPUT or: cat INPUT | groqfmt > OUTPUT or cat INPUT | groqf

Oct 6, 2022
Gomon - Go language based system monitor

Copyright © 2021 The Gomon Project. Welcome to Gomon, the Go language based system monitor Welcome to Gomon, the Go language based system monitor Over

Nov 18, 2022
Sand is the next, versatile, high-level compiled or interpreted language that's easy to learn and performant to run.

Sand is the newest, dynamically typed, interpreted programming language. Table of Contents History Project Stats History Sand was created as part of @

Mar 13, 2022
Logger - Go language is interface-oriented to implement an asynchronous log writing program

logger日志库 1、安装 go get github.com/staryjie/logger@latest 2、使用 示例: package main import ( "github.com/staryjie/logger" "time" ) func initLogger(name,

Jan 4, 2022
Go-mix - Both a tutorial paper and a library of classic TAOCP algorithms in the Go language

MIX golang This package is both a tutorial paper and a library of classic TAOCP

Jul 25, 2022
Delve is a debugger for the Go programming language.

The GitHub issue tracker is for bugs only. Please use the developer mailing list for any feature proposals and discussions. About Delve Installation L

Dec 29, 2022
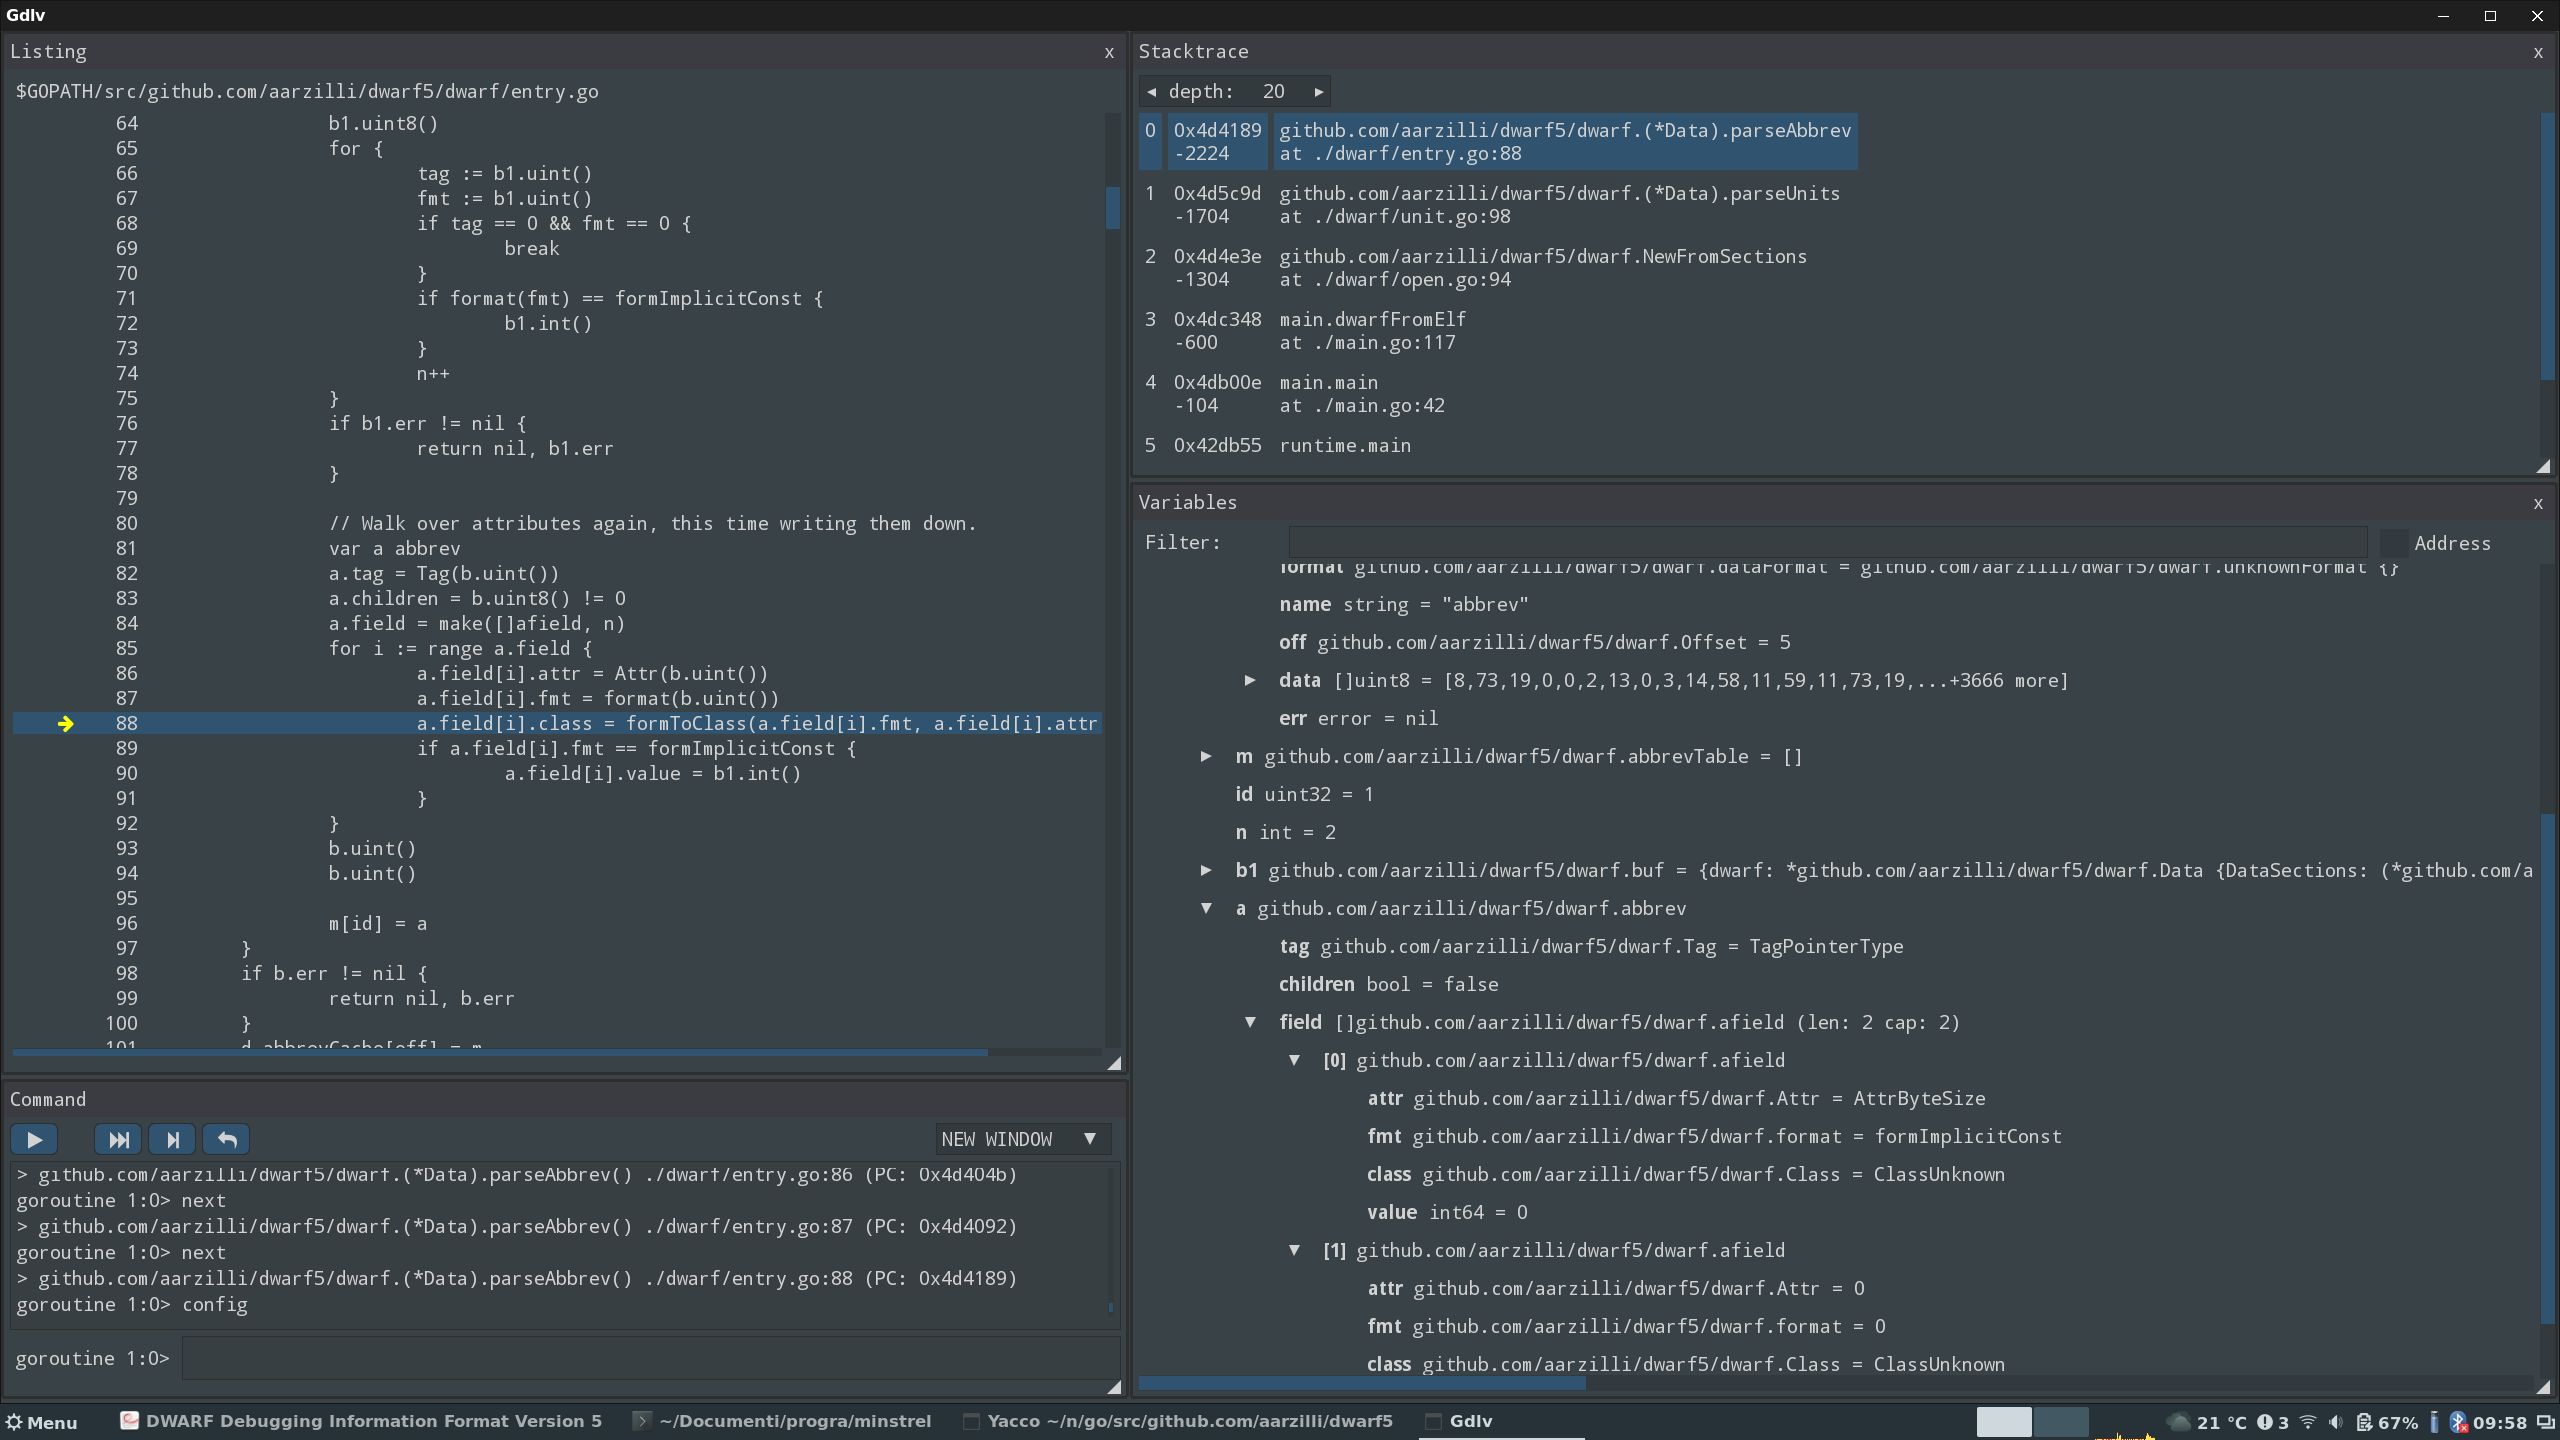
GUI frontend for Delve

GUI frontend for Delve

Jan 5, 2023
GUI frontend for Delve

Gdlv is a graphical frontend to Delve for Linux, Windows and macOS. Demo video here. Setup First install the current version of Delve, following Delve

Dec 23, 2022
Go test command line interface for dlv(delve)

What does it do? Delver makes the command line interface for starting dlv the same as the one used in go test Example Say you're using this when devel

Jan 7, 2022
Floppa programming language inspired by the brainf*ck programming language. Created just for fun and you can convert your brainf*ck code to floppa code.

Floppa Programming Language Created just for fun. But if you want to contribute, why not? Floppa p.l. inspired by the brainf*ck programming language.

Oct 20, 2022
T# Programming Language. Something like Porth, Forth but written in Go. Stack-oriented programming language.

The T# Programming Language WARNING! THIS LANGUAGE IS A WORK IN PROGRESS! ANYTHING CAN CHANGE AT ANY MOMENT WITHOUT ANY NOTICE! Something like Forth a

Jun 29, 2022
Yayx programming language is begginer friendly programming language.

Yayx Yayx programming language is begginer friendly programming language. What have yayx: Easy syntax Dynamic types Can be compiled to outhers program

Dec 27, 2021
Yayx programming language is begginer friendly programming language.

Yayx Yayx programming language is begginer friendly programming language. What have yayx: Easy syntax Dynamic types Can be compiled to outhers program

May 20, 2022
GAPID: Graphics API Debugger

GAPID: Graphics API Debugger

Dec 24, 2022
Rdebug — Real Debugger

RDebug - Real Debugger Translation 中文 1. Introduction Rdebug is an open source tool chain that focusing on efficiency of daily developing, testing and

Dec 23, 2022
Interactive Go interpreter and debugger with REPL, Eval, generics and Lisp-like macros

gomacro - interactive Go interpreter and debugger with generics and macros gomacro is an almost complete Go interpreter, implemented in pure Go. It of

Dec 30, 2022
ROFL eXtension Debugger - for League of Legends replay files

ROFLXD - ROFL eXtension Debugger This is an incomplete project. The original goal of this project was to convert GLR replays to a form that was playab

Nov 27, 2022