go-echarts 🎨 The adorable charts library for Golang

go-echarts

🎨 The adorable charts library for Golang.

Build Status Go Report Card Contributions welcome MIT License GoDoc

If a language can be used to build web scrapers, it definitely needs to provide a graceful data visualization library. --- by dongdong.

In the Golang ecosystem, there are not many choices for data visualization libraries. The development of go-echarts aims to provide a simple yet powerful data visualization library for Golang. Apache ECharts is an outstanding charting and visualization library, it supports adorable chart types and various interactive features. There are many language bindings for Echarts, for example, pyecharts. go-echarts learns from pyecharts and has evolved a lot.

中文 README

🔰 Installation

Classic way to get go-echarts

# this may be a stupid way to use v2 go-echarts without gomod(GO111MODULE=off) because of
# the next generation version management system... 🐶
# if you get a better workaround, please let me know....

$ go get -u github.com/go-echarts/go-echarts/...
$ cd $go-echarts-project
$ mkdir v2 && mv charts components datasets opts render templates types v2

Use gomod style

$ go get -u github.com/go-echarts/go-echarts/v2/...

OR

# go.mod

require github.com/go-echarts/go-echarts/v2

Version

The go-echarts project is being developed under v2 version and the active codebase is on the master branch now.

v1 and v2 are incompatible which means that you cannot upgrade go-echarts from v1 to v2 smoothly. But I think it is worth trying that new version.

Features

  • Clean and comprehensive API.
  • Visualize your data in 25+ different ways.
  • Highly configurable chart options.
  • Detailed documentation and a rich collection of examples.
  • Visualize your geographical data with 400+ maps.

📝 Usage

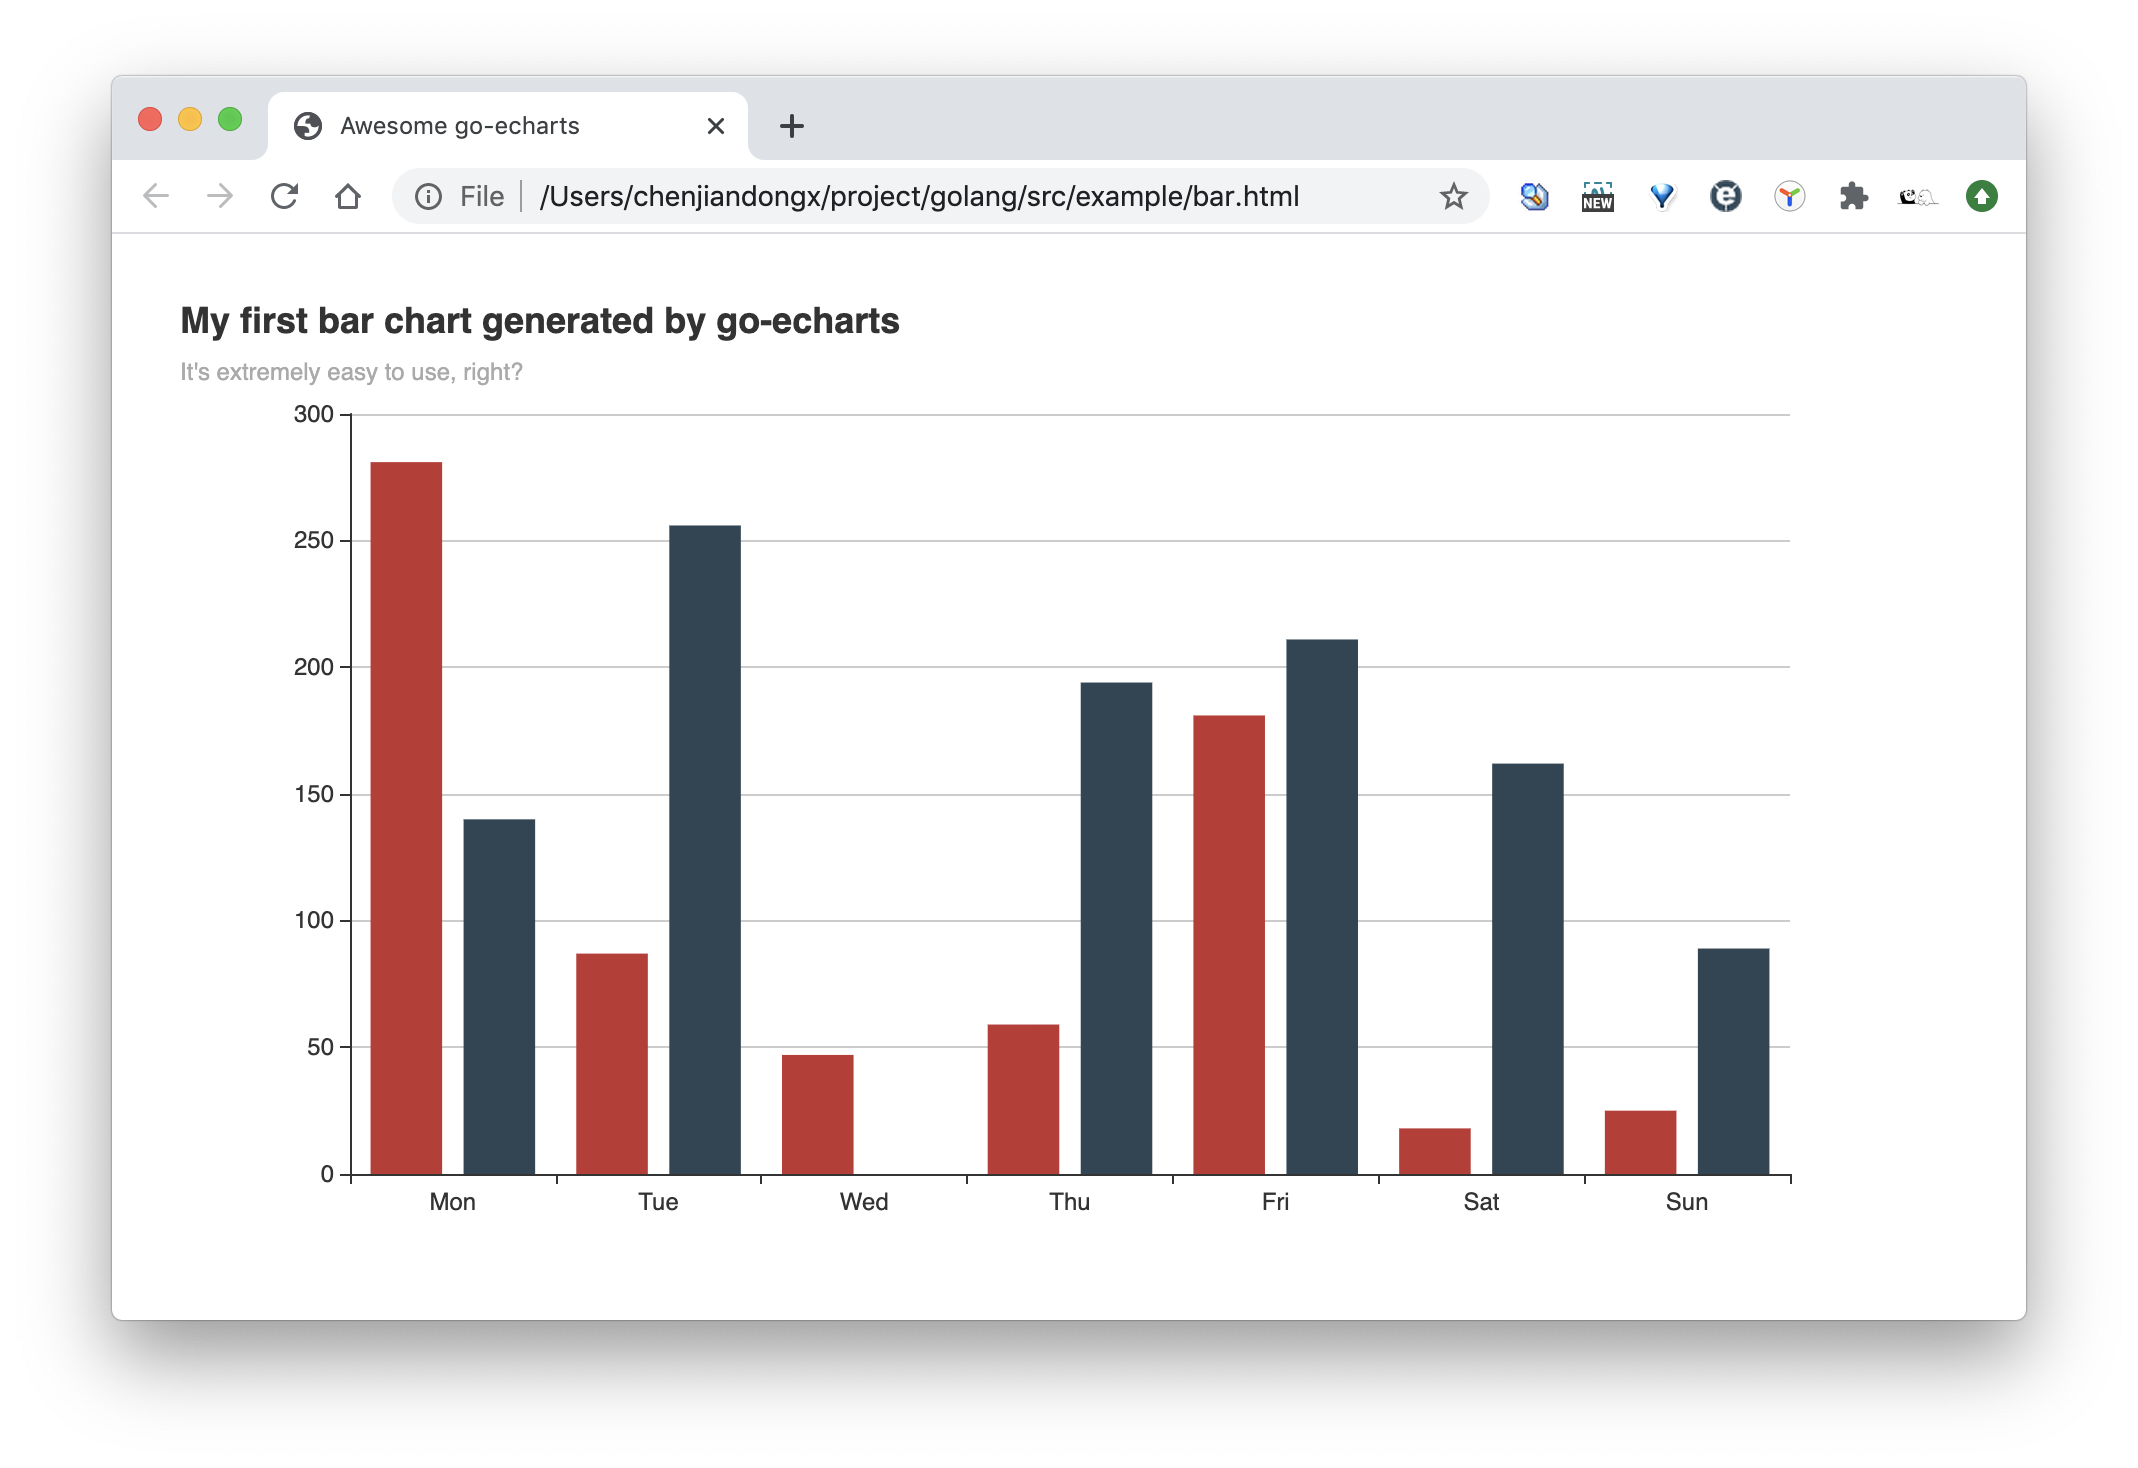
It's easy to get started with go-echarts. In this example, we create a simple bar chart with only a few lines of code.

package main

import (
	"math/rand"
	"os"

	"github.com/go-echarts/go-echarts/v2/charts"
	"github.com/go-echarts/go-echarts/v2/opts"
)

// generate random data for bar chart
func generateBarItems() []opts.BarData {
	items := make([]opts.BarData, 0)
	for i := 0; i < 7; i++ {
		items = append(items, opts.BarData{Value: rand.Intn(300)})
	}
	return items
}

func main() {
	// create a new bar instance
	bar := charts.NewBar()
	// set some global options like Title/Legend/ToolTip or anything else
	bar.SetGlobalOptions(charts.WithTitleOpts(opts.Title{
		Title:    "My first bar chart generated by go-echarts",
		Subtitle: "It's extremely easy to use, right?",
	}))

	// Put data into instance
	bar.SetXAxis([]string{"Mon", "Tue", "Wed", "Thu", "Fri", "Sat", "Sun"}).
		AddSeries("Category A", generateBarItems()).
		AddSeries("Category B", generateBarItems())
	// Where the magic happens
	f, _ := os.Create("bar.html")
	bar.Render(f)
}

And the generated bar.html is rendered as below. Isn't that cool!

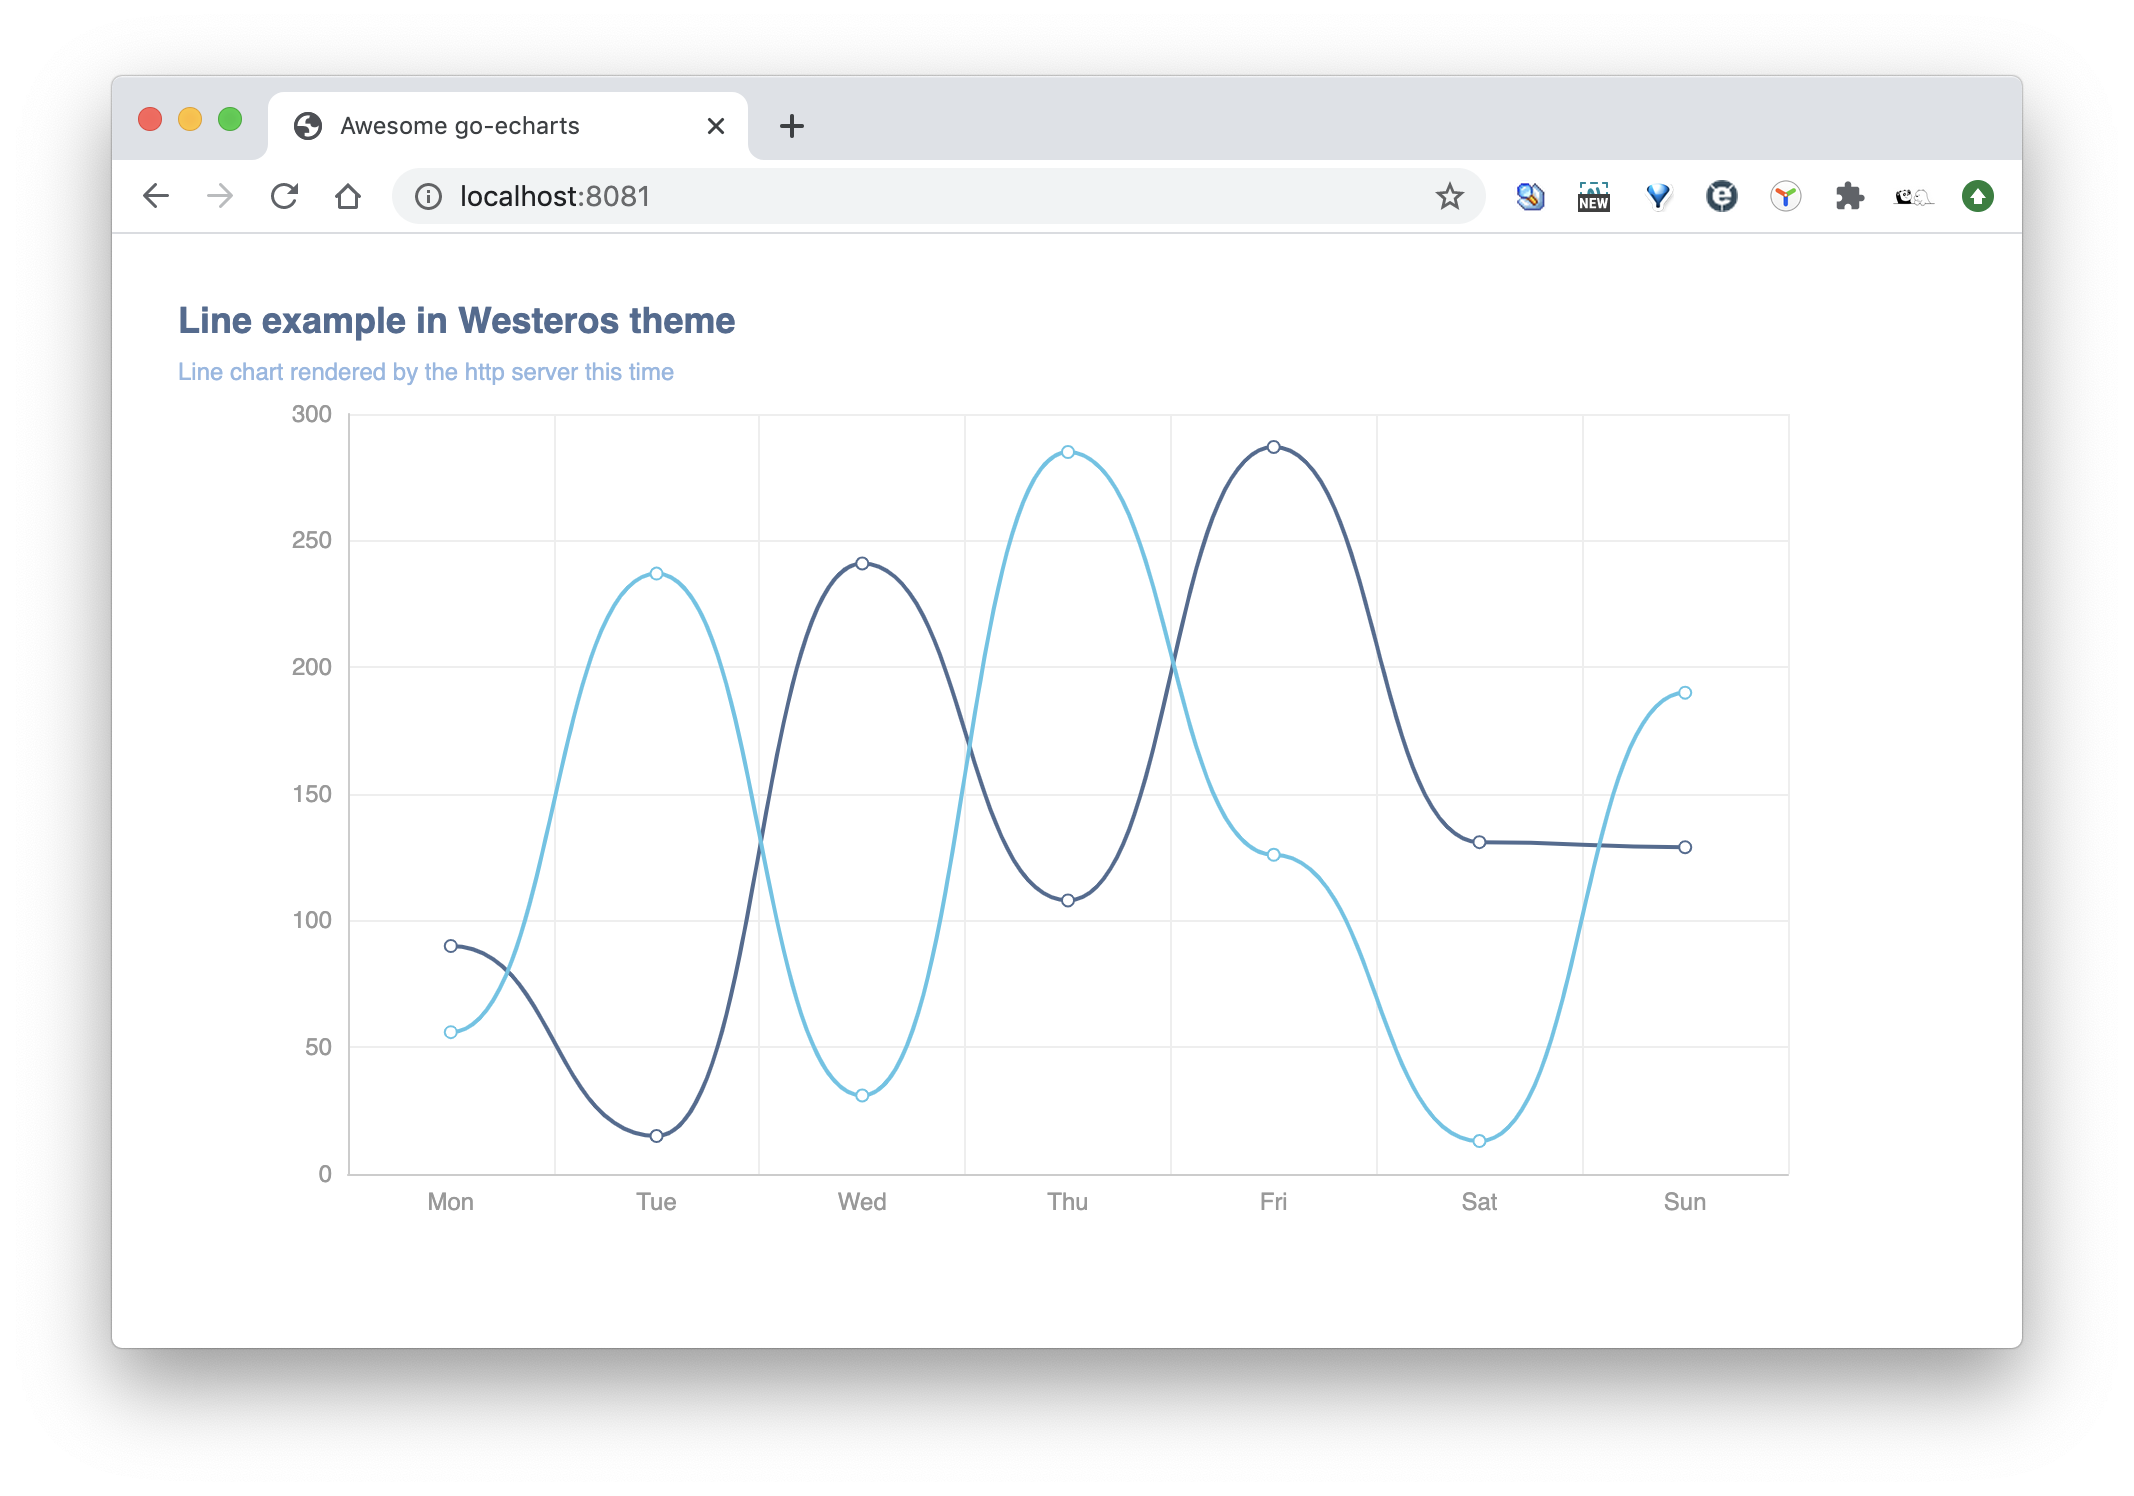
Of course we can also start a listening web server with net/http.

package main

import (
	"math/rand"
	"net/http"

	"github.com/go-echarts/go-echarts/v2/charts"
	"github.com/go-echarts/go-echarts/v2/opts"
	"github.com/go-echarts/go-echarts/v2/types"
)

// generate random data for line chart
func generateLineItems() []opts.LineData {
	items := make([]opts.LineData, 0)
	for i := 0; i < 7; i++ {
		items = append(items, opts.LineData{Value: rand.Intn(300)})
	}
	return items
}

func httpserver(w http.ResponseWriter, _ *http.Request) {
	// create a new line instance
	line := charts.NewLine()
	// set some global options like Title/Legend/ToolTip or anything else
	line.SetGlobalOptions(
		charts.WithInitializationOpts(opts.Initialization{Theme: types.ThemeWesteros}),
		charts.WithTitleOpts(opts.Title{
			Title:    "Line example in Westeros theme",
			Subtitle: "Line chart rendered by the http server this time",
		}))

	// Put data into instance
	line.SetXAxis([]string{"Mon", "Tue", "Wed", "Thu", "Fri", "Sat", "Sun"}).
		AddSeries("Category A", generateLineItems()).
		AddSeries("Category B", generateLineItems()).
		SetSeriesOptions(charts.WithLineChartOpts(opts.LineChart{Smooth: true}))
	line.Render(w)
}

func main() {
	http.HandleFunc("/", httpserver)
	http.ListenAndServe(":8081", nil)
}

image

🔖 Gallery

bar boxplot effectScatter funnel gague geo graph heatmap kline line liquid map parallel pie radar scatter wordCloud bar3D line3D sankey scatter3D surface3D themeRiver overlap

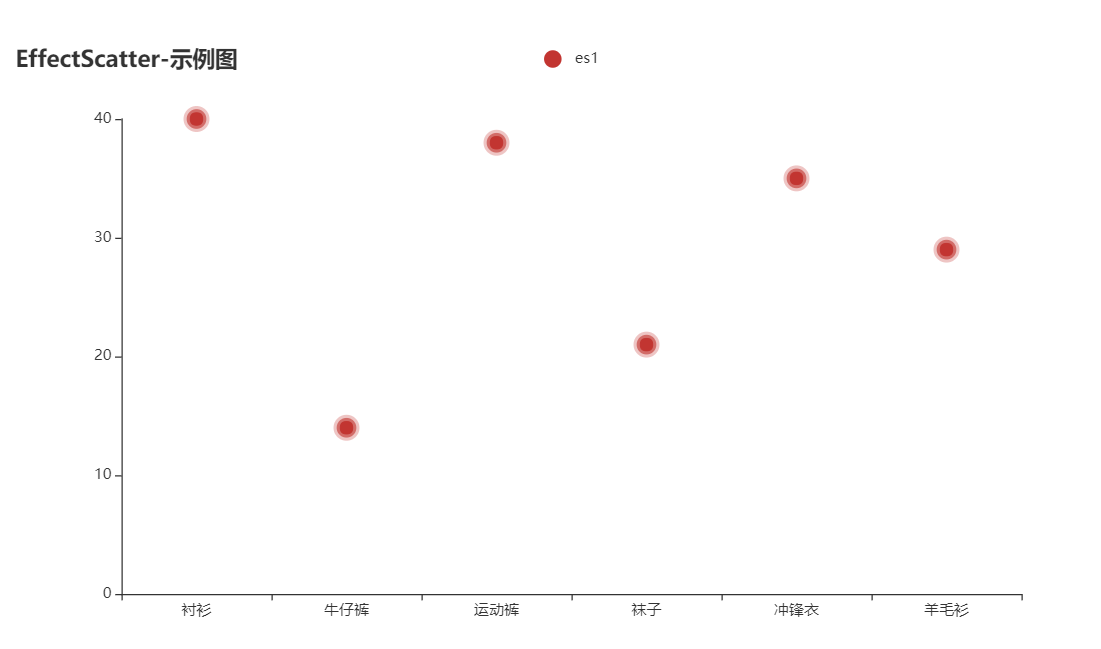
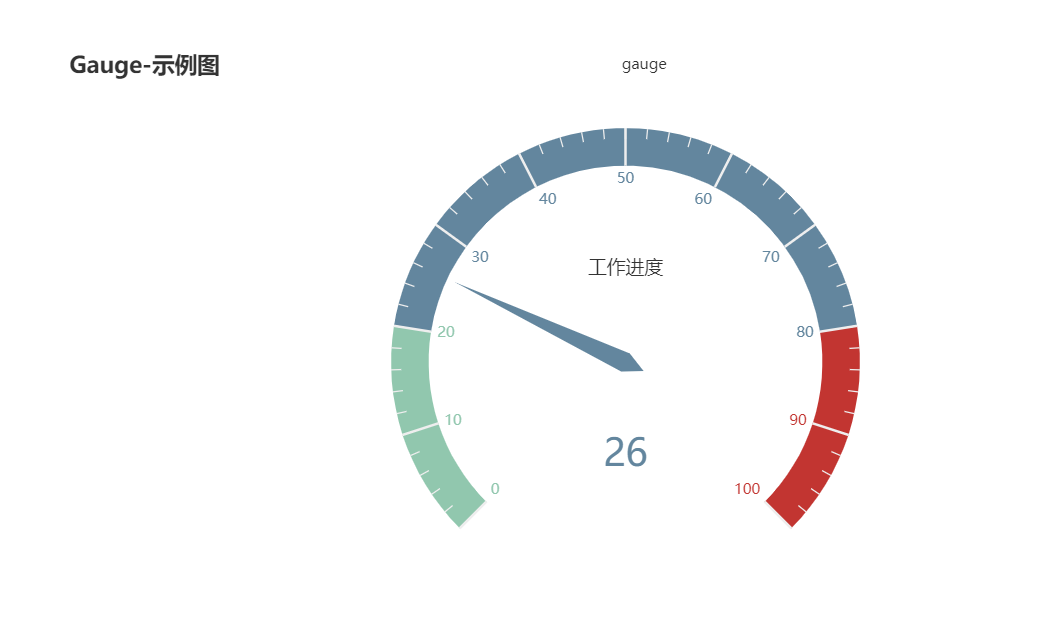
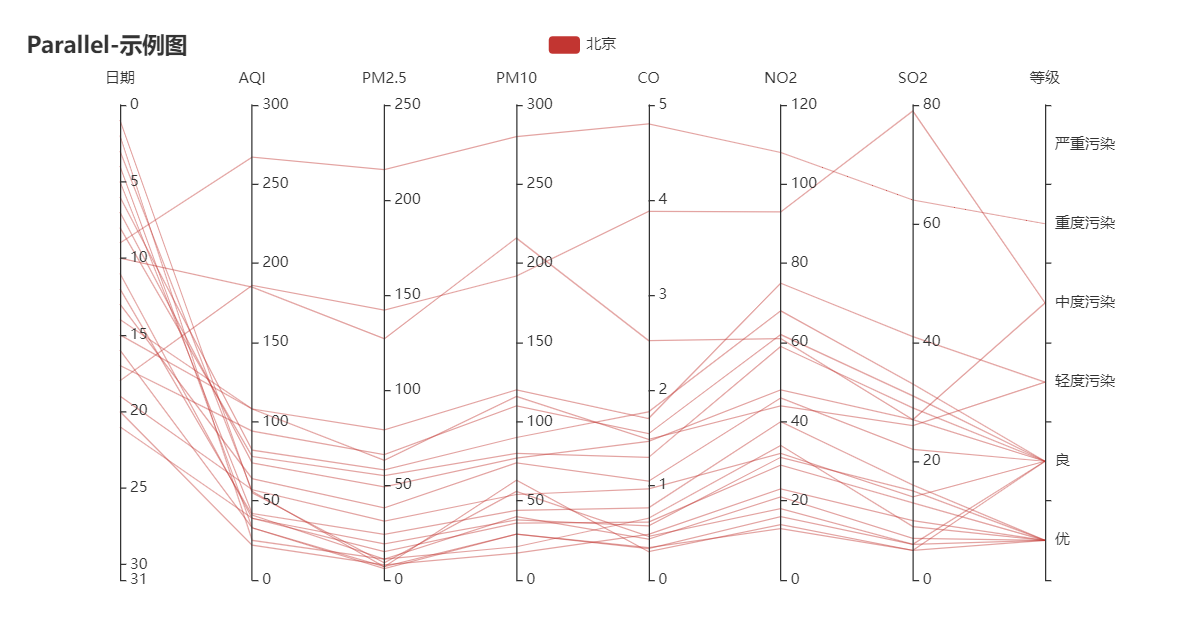
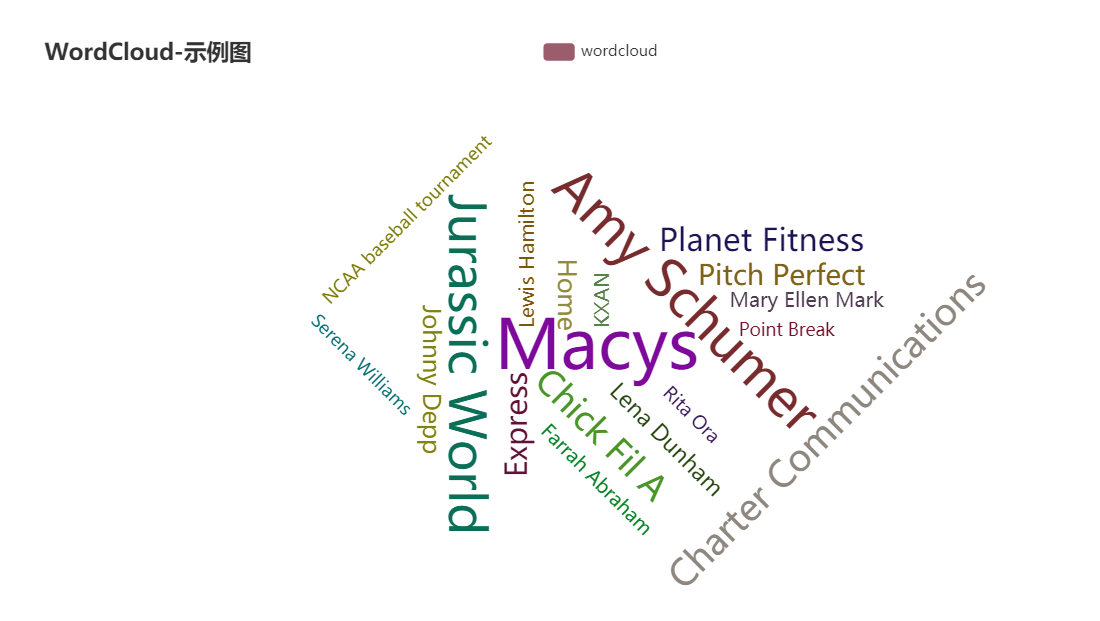
For more information, please refer to go-echarts/examples and the GoDoc.

💡 Contributing

go-echarts is an open source project and built on the top of other open-source projects, hence we are always very happy to have contributions, whether for typo fix, bug fix or big new features. Please do not ever hesitate to ask a question or send a pull request.

We strongly value documentation and integration with other projects so we are very glad to accept improvements for these aspects.

😉 Authors

Code with ❤️ by chenjiandongx / Koooooo-7 and lovely contributors

📃 License

MIT ©chenjiandongx

Owner
go-echarts
go-echarts dev team
go-echarts
Comments
  • Candlestick & Bar chart together

    Candlestick & Bar chart together

    https://echarts.apache.org/examples/en/editor.html?c=candlestick-large

    Is it possible to make a chart like this one with both the candlestick and a bar chart together ? I cannot find an example using the go library.

    Thanks in advance.

  • TooltipOpts僅提供中文嗎?Are TooltipOpts only available in Chinese?

    TooltipOpts僅提供中文嗎?Are TooltipOpts only available in Chinese?

    ––––– English version below ––––

    你好 !

    感謝您提供的精彩庫,到目前為止,我發現它非常有幫助。

    image

    的文字疊加層是否僅提供中文? 是否可以將它們配置為使用瀏覽器語言或英語?

    如果可以為我提供適當的代碼,我可以考慮向您發送拉取請求以添加該功能(如果該功能今天不存在)。

    謝謝。

    Hello!

    Thank you for the wonderful library, so far I've found it very helpful.

    image

    Are the text overlays for TooltipOpts only available in Chinese? Is it possible to configure them to use the browser language or English?

    If you could point me to the appropriate code, I can look into sending you a pull request to add the feature if it doesn't exist today.

    Thank you!

  • The method name `Scatter.AddYAxis` is misleading.

    The method name `Scatter.AddYAxis` is misleading.

    The method name Scatter.AddYAxis is misleading. It actually adding a data series. For example, one can add (x, y) coordinates as two-element slices

    zs := [][]float64{
    	[]float64{1, 5},
    	[]float64{2, 1},
    	[]float64{8, 2},
    	[]float64{9, 10},
    	[]float64{15, 20},
    }
    scatter.AddYAxis("My Points", zs)
    

    image

  • How to get e-chart compatitable Options as JSON from chart object ?

    How to get e-chart compatitable Options as JSON from chart object ?

    As I understood from exploring china docs (khe, khe....), the are possibilities to render your chart to the predefined templates.

    In my project I need to get only JSON data that represents whole chart and save it as string.

    I understands that i can rewrite templates, but with current architecture I would need to refactor whole library or write my own.

    Is it possible to get JSON chart representation or not?

  • charts: renderToWriter signature

    charts: renderToWriter signature

    instead of:

    func renderToWriter(chart interface{}, renderName string, removeStr []string, w ...io.Writer) error {...}
    

    https://github.com/go-echarts/go-echarts/blob/cbb3b43ade5d54354441b09f4bdbd0e6f74ebe67/charts/engine.go#L44

    I believe it would be better written as:

    func renderToWriter(w io.Writer, chart interface{}, renderName string, removeStr []string) error
    

    leaving users to call it with: io.MultiWriter(w1, w2, w3) if they want to.

  • Add support for treemap type graph

    Add support for treemap type graph

    This patch adds support in go-echarts for treemap type graph (already supported in Apache ECharts). https://echarts.apache.org/en/option.html#series-treemap

    Closes #29

  • [Bug]SetSeriesOptions overwrites for multiple series in one graph

    [Bug]SetSeriesOptions overwrites for multiple series in one graph

    Describe the bug When using multiple series, I tried to color the lines using SetSeriesOptions for each series, but this resulted in both series having the same options.

    using v2.2.1

    To Reproduce: Create an charts project from the line sample, and structure it as follows

            line := charts.NewLine()
    
    	line.SetXAxis(getDates(d)).AddSeries("series1", getVals(d)).
    		SetSeriesOptions(
    			charts.WithLabelOpts(opts.Label{
    				Show: false,
    			}),
    			charts.WithAreaStyleOpts(opts.AreaStyle{
    				Color:   "#0465db",
    				Opacity: 0.3,
    			}),
    			charts.WithLineChartOpts(opts.LineChart{
    				Smooth: true,
    			}),
    			charts.WithLineStyleOpts(opts.LineStyle{
    				Color: "#1cace6",
    			}),
    		)
    
    	 line.AddSeries("series2", getVals(d2)).
    		SetSeriesOptions(
    			charts.WithLabelOpts(opts.Label{
    				Show: false,
    			}),
    			charts.WithLineChartOpts(opts.LineChart{
    				Smooth: true,
    			}),
    			charts.WithLineStyleOpts(opts.LineStyle{
    				Color: "#2EFEF7",
    			}),
    		)
    

    Expected behavior Using SetSeriesOptions for each series should result in the lineStyle, areaStyle etc. being applied for each line independently in the resulting e-charts html

    Screenshots test

    Also wanted to say thanks again for writing this, as I found this project quite useful and easy to use

  • Working Offline

    Working Offline

    I noticed that the generated html file is have the below 2 lines:

        <script src="https://go-echarts.github.io/go-echarts-assets/assets/echarts.min.js"></script>
        <link href="https://go-echarts.github.io/go-echarts-assets/assets/bulma.min.css" rel="stylesheet">
    

    So, if I'm working offline, without internet connection, my file will not work properly, is there a way to work it off line, so I download these 2 files, and ask my output file to read the offline copy instead of the online one?

    I noticed it is managed at the header and at base

    package templates
    
    var HeaderTpl = `
    {{ define "header" }}
    <head>
        <meta charset="utf-8">
        <title>{{ .PageTitle }}</title>
    {{- range .JSAssets.Values }}
        <script src="{{ . }}"></script>
    {{- end }}
    {{- range .CSSAssets.Values }}
        <link href="{{ . }}" rel="stylesheet">
    {{- end }}
    </head>
    {{ end }}
    `
    

    and

    // InitOpts contains options for the canvas.
    type InitOpts struct {
    
    	// 静态资源 host 地址
    	AssetsHost string `default:"https://go-echarts.github.io/go-echarts-assets/assets/"`
    
    }
    
  • Bar chart doesn't render correctly for some reason

    Bar chart doesn't render correctly for some reason

    `package main
    
    import (
    	"log"
    	"os"
    
    	"github.com/go-echarts/go-echarts/charts"
    )
    
    func main() {
    	accounts := []string{"1111", "2222", "3333", "4444"}
    	resacct := make(map[string]int64)
    	resacct["1111"] = 25
    	resacct["2222"] = 50
    	resacct["3333"] = 10
    	resacct["4444"] = 70
    	bar := charts.NewBar()
    	bar.SetGlobalOptions(charts.TitleOpts{Title: "Resource Counts by AWS Accounts"})
    	for k, v := range resacct {
    		bar.AddXAxis(accounts).AddYAxis(k, []int64{v})
    	}
    	f, err := os.Create("bar.html")
    	if err != nil {
    		log.Println(err)
    	}
    	bar.Render(f)
    }
    `
    

    Output:

    Screen Shot 2020-09-17 at 6 54 55 PM

    It is not very clear why all the bars are grouped by 1111 although the values are being displayed.

  • How to add chart to my template anywhere I want?

    How to add chart to my template anywhere I want?

    Hi!

    Sorry if this is a dumb question, but how can I add the generated chart exactly where I want in my html? Without having to generate a HTML file, if possible. The best I found is chart.render(w), but it renders at the top of the page, and I need it inside a specific DIV.

    Example:

    {{define "Index"}}
    {{template "Navbar"}}
        <div class="main-container">
            <!-- Add the chart here (maybe using {{.}} to call the chart?) -->
        </div>
    {{template "Footer"}}
    {{end}}


    Thanks in advance!

  • possible to add a release number?

    possible to add a release number?

    Hello, When I try to build my project with gitlab CICD pipeline I get a checksum mismatch securty error.

    It seems this problem is recurent for go modules without any release number when using repository managers like artifactory. Could you please add a release number on master branch (ie v1.0.0) ? Thanks a lot

  • How do you have sporadic data?

    How do you have sporadic data?

    Say I want to plot stock orders on a chart. These don't happen every line/row/minute. How do you have a chart with data plotted on some lines but not all. I note that there is an example in the issues for this that does not work because withEncode or whatever it is is no longer part of the library I think.

  • Bar3D uses scatter3D rather than bar3D for type?

    Bar3D uses scatter3D rather than bar3D for type?

    Hi,

    It looks like Bar3D is using scatter3D rather than bar3D?

    c.addSeries(types.ChartScatter3D, name, data, options...)
    

    https://github.com/go-echarts/go-echarts/blob/f66a5da680f3be32384dfc4c591fe09c0527887f/charts/bar3d.go#L28

    Thanks.

  • Draw line and kline chart

    Draw line and kline chart

    Hello! Is there any possibility to draw kline chart with line chart below belongs to one zoom on x axis? Like in image image I want to have different y axis for charts but one x axis

  • added mark area to charts series and opts series

    added mark area to charts series and opts series

    impl missing mark areas

    charts.WithMarkAreaNameCoordItemOpts(opts.MarkAreaNameCoordItem{
    	Name:        "TEST",
    	Coordinate0: []interface{}{"25.02.22 02:30", 1.120},
    	Coordinate1: []interface{}{"25.02.22 10:30", 1.125},
    	ItemStyle: &opts.ItemStyle{
    		Color: "rgba(55, 173, 177, 0.4)",
    	},
    }),
    

    image

  • [Showcase] Document Contribution Welcome.

    [Showcase] Document Contribution Welcome.

    Hi lovely folks.

    Although we have some examples located in go-echarts/examples, we haven't covered all configs/opts to users who wanna get more references and makes it more handy. so, let us build it together. Welcome to send your examples to go-echarts/awesome-go-echarts to benefit to more users.

    Thx for using and contributing to go-echarts. 🚀

  • Generic interface that all chart types adhere to

    Generic interface that all chart types adhere to

    I want to create a bunch of functions that work regardless of chart type. I realise I could use Go generics, but hoping there is an interface or something that all charts adhere to so I can just use that? The idea being I can pass any chart type to a function to add a legend or whatever Is there an example potentially? Thanks

A charts library for Golang

go-charts go-charts基于go-chart生成数据图表,无其它模块的依赖纯golang的实现,支持svg与png的输出,Apache ECharts在前端开发中得到众多开发者的认可,go-charts兼容Apache ECharts的配置参数,简单快捷的生成相似的图表(svg或png

Dec 29, 2022
SSR charts as a Component

kyoto charts SSR Charts as a Component. Prototyped for using in kyoto pages. Kyoto charts are using go-chart under the hood to generate charts on serv

Jun 3, 2022
Helm : a tool for managing Charts

Helm is a tool for managing Charts. Charts are packages of pre-configured Kubernetes resources.

Aug 25, 2022
Termbar - Generate terminal charts in Go

termbar Generate terminal bar charts in Go. a: ▇▇▇▇▇▇▇▇▇▇▇▇▇▇▇▇▇▇▇▇▇▇▇▇▇ 50 b: ▇

Mar 2, 2022
go chart is a basic charting library in native golang.

Package chart is a very simple golang native charting library that supports timeseries and continuous line charts.

Jan 9, 2023
Ltree Visualizer - A golang library to visualize postgres ltree type data using DOT language and Graphviz

Ltree Visualizer A golang library to visualize postgres ltree type data using DOT language and Graphviz What is Ltree? Ltree is a data type which is u

Jun 12, 2022
Gfx - Golang file system extension library

gfx Golang文件操作扩展库,包含工作和生活中关于文件操作的各种有用的使用方法,包括 更友好的API 文件创建 文件删除 文件复制 一切皆可配置 文件名

Mar 10, 2022
3D Wireframe Drawing Library for Go

pinhole 3D Wireframe Drawing Library for Go Javascript Version Demo Why does this exist? I needed a CPU based 3D rendering library with a very simple

Dec 10, 2022
HSM package provides a simple state chart library written in Go.

UML HSM HSM package provides a simple state chart library written in Go. Supported UML State Chart Features Feature Implemented Test case Simple state

Apr 14, 2022
fswatch, this library could help watching filesystem changes, like macOS fswatch

fswatch go library for simple UNIX file system watching fswatch provides simple UNIX file system watching in Go. It is based around the Watcher struct

Jan 7, 2022
Globe wireframe visualizations in Golang

globe Globe wireframe visualizations in Golang backed by pinhole. Getting Started Install globe with $ go get -u github.com/mmcloughlin/globe Start wi

Jan 7, 2023
🚀Statsview is a real-time Golang runtime stats visualization profiler

Statsview is a real-time Golang runtime stats visualization profiler. It is built top on another open-source project, go-echarts, which helps statsview to show its graphs on the browser.

Dec 29, 2022
A golang implementation of endlessh exporting Prometheus metrics, visualized by a Grafana dashboard.

endlessh-go A golang implementation of endlessh exporting Prometheus metrics, visualized by a Grafana dashboard. Introduction Endlessh is a great idea

Dec 23, 2022
Interactive dependency graph visualization tool for golang

Interactive dependency graph visualization tool for golang using the awesome cytoscape graph visualizer.

Sep 1, 2022
🎨 The adorable charts library for Golang

go-echarts ?? The adorable charts library for Golang. If a language can be used to build web scrapers, it definitely needs to provide a graceful data

Dec 30, 2022
A charts library for Golang

go-charts go-charts基于go-chart生成数据图表,无其它模块的依赖纯golang的实现,支持svg与png的输出,Apache ECharts在前端开发中得到众多开发者的认可,go-charts兼容Apache ECharts的配置参数,简单快捷的生成相似的图表(svg或png

Dec 29, 2022
✨ #PTerm is a modern go module to beautify console output. Featuring charts, progressbars, tables, trees, and many more 🚀 It's completely configurable and 100% cross-platform compatible.

?? PTerm | Pretty Terminal Printer A golang module to print pretty text Show Demo Code PTerm.sh | Installation | Documentation | Quick Start | Example

Dec 27, 2022
Provide basic charts in go

Charts for Go Basic charts in go. This package focuses more on autoscaling, error bars, and logarithmic plots than on beautifull or marketing ready ch

Dec 17, 2022
Provide basic charts in go

Charts for Go Basic charts in go. This package focuses more on autoscaling, error bars, and logarithmic plots than on beautifull or marketing ready ch

Dec 17, 2022
Very simple charts with some debug data for Go programs

debugcharts Go memory debug charts. This package uses Plotly chart library. It is open source and free for use. Installation go get -v -u github.com/m

Dec 14, 2022