A repository for plotting and visualizing data

Gonum Plot

Build Status Build status Build status codecov.io coveralls.io GoDoc go.dev reference

gonum/plot is the new, official fork of code.google.com/p/plotinum. It provides an API for building and drawing plots in Go. Note that this new API is still in flux and may change. See the wiki for some example plots.

For additional Plotters, see the Community Plotters Wiki page.

There is a discussion list on Google Groups: [email protected].

gonum/plot is split into a few packages:

  • The plot package provides simple interface for laying out a plot and provides primitives for drawing to it.
  • The plotter package provides a standard set of Plotters which use the primitives provided by the plot package for drawing lines, scatter plots, box plots, error bars, etc. to a plot. You do not need to use the plotter package to make use of gonum/plot, however: see the wiki for a tutorial on making your own custom plotters.
  • The plotutil package contains a few routines that allow some common plot types to be made very easily. This package is quite new so it is not as well tested as the others and it is bound to change.
  • The vg package provides a generic vector graphics API that sits on top of other vector graphics back-ends such as a custom EPS back-end, draw2d, SVGo, X-Window, gopdf, and Gio.

Documentation

Documentation is available at:

https://godoc.org/gonum.org/v1/plot

Installation

You can get gonum/plot using go get:

go get gonum.org/v1/plot/...

If you write a cool plotter that you think others may be interested in using, please post to the list so that we can link to it in the gonum/plot wiki or possibly integrate it into the plotter package.

Owner
Consistent, composable, and comprehensible scientific code
null
Comments
  • Adds capability for colored scatter plots (issue #195)

    Adds capability for colored scatter plots (issue #195)

    I have closed the previous pull request, and created this one according to your comments @kortschak and @ctessum. Thanks!

    @ctessum I decided to send this PR anyway (and it's up to you, obviously, to accept it or not right now), so that at least the plot has this capability and it will fix the #195 issue. Meanwhile, I will start working on the alternative solution which you have proposed. It should definitely look much more elegant and be an improvement of the existing way of making scatter, scatter colour and bubble plots.

  • Creating a heatmap with 0 depth (min value == max value) causes panic

    Creating a heatmap with 0 depth (min value == max value) causes panic

    Converting depth / Z range into colorbar scaling generates a divide by 0 NaN.

    While 0 depth / flat heatmaps are not themselves meaningful, generating heatmaps on provided data sets can see cases where all values in the map are identically equal...

  • Liberation fonts

    Liberation fonts

    First stab at embedding Liberation fonts.

    The embedded asset is generated by running go generate ./vg/fonts vg/fonts/mk-fonts.go downloads a version of the liberation fonts from Fedora, untars it somewhere and runs go-bindata -o liberation_fonts_generated.go

    The increase in size for a given binary (the histogram test) is as follows:

    run-hist-old  8458416
    run-hist-new 10809200
    

    perhaps we could recoup some space by having people import _ "gonum.org/plot/vg/fonts" using the same kind of mechanism than database/sql's Driver ? In that case, perhaps it would be better to have the Liberation fonts live under "gonum.org/plot/vg/fonts/liberation" and put the fonts registration mechanism under "vg/fonts" But this would require client's code modification... (a relatively simple one, but still...)

    Also, there is a fair amount of test-files updates... could someone make sure I haven't made any mistake? (the Liberation fonts are somewhat different in height.)

    Fixes #107

  • added method for canvas tiles; changed plotter examples to tiles

    added method for canvas tiles; changed plotter examples to tiles

    I've created a method for tiling the canvas to make subfigures, and I have also changed the plotter examples to be put into subfigures instead of a bunch of individual files. PTAL.

  • vgsvg: express font size in px units, not points

    vgsvg: express font size in px units, not points

    We need to properly scale the fonts size relative to the graphs size.

    Currently, the size of the graph (lines, glyphs) is expressed in "user unit" (px), and the font size in point units (pt).

    The size of text relative to the graph would vary with different dpi.

    The suggested solution is to express font size in px, which is the same as without unit. This will require to define a scaling factor involving c.dpi.

    This is with current master.

  • plot: fix axis labelling

    plot: fix axis labelling

    This goes a long way towards fixing #403, though there are problems that I believe are a result of aggressive cropping of the plot space after the axes have been decided (the axes that show up here with only one major tick mark do have the labels created, but the plot does not end up rendering them).

    @eaburns Can you suggest anything here?

    /cc @decibelcooper

  • Update freetype imports

    Update freetype imports

    Looks like code.google.com/p/freetype-go redirects to github.com/golang/freetype now. This fixes go get for this project, but some dependent projects like draw2d may still refer to the old path.

  • plotter: plotting an histogram in logscale

    plotter: plotting an histogram in logscale

    hi,

    consider the following code:

    func TestHistogramLogScale(t *testing.T) {
    	rnd := rand.New(rand.NewSource(1))
    	n := 1000
    	vals := make(Values, n)
    	for i := 0; i < n; i++ {
    		vals[i] = rnd.NormFloat64()
    	}
    
    	p, err := plot.New()
    	if err != nil {
    		log.Panic(err)
    	}
    	p.Title.Text = "Histogram in logy"
    	p.Y.Min = 0.1
    	p.Y.Scale = plot.LogScale{}
    	p.Y.Tick.Marker = plot.LogTicks{}
    
    	h, err := NewHist(vals, 16)
    	if err != nil {
    		t.Fatal(err)
    	}
    	h.Normalize(1)
    	p.Add(h)
    
    	err = p.Save(200, 200, "testdata/histogram_log.png")
    	if err != nil {
    		t.Fatal(err)
    	}
    }
    

    this will panic:

    === RUN   TestHistogramLogScale
    --- FAIL: TestHistogramLogScale (0.01s)
    panic: Values must be greater than 0 for a log scale. [recovered]
    	panic: Values must be greater than 0 for a log scale.
    
    goroutine 5 [running]:
    testing.tRunner.func1(0xc42005a9c0)
    	/usr/lib/go/src/testing/testing.go:622 +0x29d
    panic(0x7d7160, 0xc4200f7790)
    	/usr/lib/go/src/runtime/panic.go:489 +0x2cf
    github.com/gonum/plot.LogTicks.Ticks(0x0, 0x3fda71c2dac35ff2, 0xc420123420, 0x4cbec8, 0x857cfb)
    	/home/binet/work/gonum/src/github.com/gonum/plot/axis.go:429 +0x400
    github.com/gonum/plot.(*LogTicks).Ticks(0xc89e68, 0x0, 0x3fda71c2dac35ff2, 0x4cc5a5, 0x857cfb, 0x9)
    	<autogenerated>:42 +0x5d
    github.com/gonum/plot.(*verticalAxis).size(0xc420123af8, 0x40278e0000000000)
    	/home/binet/work/gonum/src/github.com/gonum/plot/axis.go:282 +0x7a
    github.com/gonum/plot.(*Plot).Draw(0xc4200b3000, 0x7f6fa2e5d428, 0xc420058de0, 0x0, 0x0, 0x4069000000000000, 0x406712b000000000)
    	/home/binet/work/gonum/src/github.com/gonum/plot/plot.go:168 +0x232
    github.com/gonum/plot.(*Plot).WriterTo(0xc4200b3000, 0x4069000000000000, 0x4069000000000000, 0x86945b, 0x3, 0x0, 0x400aa49aec34e97f, 0x1, 0xc4200f7190)
    	/home/binet/work/gonum/src/github.com/gonum/plot/plot.go:455 +0x143
    github.com/gonum/plot.(*Plot).Save(0xc4200b3000, 0x4069000000000000, 0x4069000000000000, 0x869444, 0x1a, 0x0, 0x0)
    	/home/binet/work/gonum/src/github.com/gonum/plot/plot.go:481 +0x147
    github.com/gonum/plot/plotter.TestHistogramLogScale(0xc42005a9c0)
    	/home/binet/work/gonum/src/github.com/gonum/plot/plotter/histogram_test.go:129 +0x42b
    testing.tRunner(0xc42005a9c0, 0x873468)
    	/usr/lib/go/src/testing/testing.go:657 +0x96
    created by testing.(*T).Run
    	/usr/lib/go/src/testing/testing.go:697 +0x2ca
    exit status 2
    

    because, even though p.Y.Min was set, the empty bins of the histogram will still be "evaluated".

    Locally, I have implemented a not completely satisfactory hack: implement "clipping" decorators for LogScale and LogTicks:

    type ClipScale struct {
    	Min  float64
    	Max  float64
    	Norm plot.Normalizer
    }
    
    func (cs ClipScale) Normalize(min, max, x float64) float64 {
    	min = math.Max(cs.Min, min)
    	max = math.Min(cs.Max, max)
    	switch {
    	case x < cs.Min:
    		x = cs.Min
    	case x > cs.Max:
    		x = cs.Max
    	}
    	return cs.Norm.Normalize(min, max, x)
    }
    
    var _ plot.Normalizer = ClipScale{}
    
    type ClipTicker struct {
    	Min    float64
    	Max    float64
    	Ticker plot.Ticker
    }
    
    var _ plot.Ticker = ClipTicker{}
    
    func (ct ClipTicker) Ticks(min, max float64) []plot.Tick {
    	min = math.Max(min, ct.Min)
    	max = math.Min(max, ct.Max)
    	return ct.Ticker.Ticks(min, max)
    }
    

    and with:

    		p.Y.Scale = ClipScale{p.Y.Min, math.Inf(+1), plot.LogScale{}}
    		p.Y.Tick.Marker = ClipTicker{p.Y.Min, math.Inf(+1), plot.LogTicks{}}
    

    but it's not competely satisfactory because then we get histo-bars for these empty bins:
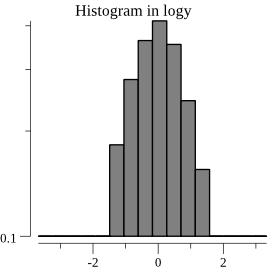
 histogram_log

    any idea ?

  • axis: Incorrect positioning of tick marks new scheme

    axis: Incorrect positioning of tick marks new scheme

    Starting with commit e7f526d68a91a8b21c225cdbbbd8662d53c541f4, there is a problem with positioning and/or labeling of tick marks. The new scheme rounds tick labels, but the tick marks do not move to reflect this. The code could be changed to move the tick marks to reflect the labels, but this would ruin the regular tick mark positioning. I believe it fundamentally does not make sense to round the tick marks and/or labels.

    The problem is exemplified by this plot generated before and after the commit in question (using the go-hep.org hplot package which in-turn uses gonum plot), where the peak on the y axis is ideally 3.096:

    Before

    before

    After

    after

    One can see that in the After case, the vertical tick labels misrepresent the position of the peak.

  • vgx11: fix translate offset

    vgx11: fix translate offset

    Address issue #179 by translating the image to (0,-h) so (0,0) is at the bottom-left corner for the X11 backend.

    go test ./... will skip the X11 test if $DISPLAY is not defined.

  • Fonts are distributed as datafiles

    Fonts are distributed as datafiles

    Original issue 80 created by eaburns on 2012-09-20T16:12:32.000Z:

    If Plotinum is included with a program than that binary cannot be distributed to machines without the Plotinum source.

    A possible solution to this is to embed the data files into the Plotinum source. This may violate some GPL stuff, however...

  • vg/vggio seems broken with current release of gioui

    vg/vggio seems broken with current release of gioui

    I'm trying to use gonum plot with gio.

    I copied the example at https://github.com/gonum/plot/blob/master/vg/vggio/vggio_example_test.go and tried to run it somehow. The result when building is:

    Build Error: go build -o /Users/maygames/Projects/plottest/__debug_bin -gcflags all=-N -l .
    # gonum.org/v1/plot/vg/vggio
    ../../go/pkg/mod/gonum.org/v1/[email protected]/vg/vggio/context.go:36:13: undefined: op.StateOp
    ../../go/pkg/mod/gonum.org/v1/[email protected]/vg/vggio/context.go:45:23: undefined: op.Save
    ../../go/pkg/mod/gonum.org/v1/[email protected]/vg/vggio/context.go:63:12: cannot use f32.Pt(float32(x), float32(y)) (value of type "gioui.org/f32".Point) as type image.Point in argument to op.Offset
    ../../go/pkg/mod/gonum.org/v1/[email protected]/vg/vggio/vggio.go:231:15: undefined: clip.Dash
    ../../go/pkg/mod/gonum.org/v1/[email protected]/vg/vggio/vggio.go:241:3: unknown field 'Style' in struct literal of type clip.Stroke
    ../../go/pkg/mod/gonum.org/v1/[email protected]/vg/vggio/vggio.go:241:15: undefined: clip.StrokeStyle
    ../../go/pkg/mod/gonum.org/v1/[email protected]/vg/vggio/vggio.go:243:16: undefined: clip.FlatCap
    ../../go/pkg/mod/gonum.org/v1/[email protected]/vg/vggio/vggio.go:245:3: unknown field 'Dashes' in struct literal of type clip.Stroke
    ../../go/pkg/mod/gonum.org/v1/[email protected]/vg/vggio/vggio.go:260:9: clip.Outline{…}.Op().Add undefined (type clip.Op has no field or method Add)
    ../../go/pkg/mod/gonum.org/v1/[email protected]/vg/vggio/vggio.go:334:8: undefined: unit.Px
    ../../go/pkg/mod/gonum.org/v1/[email protected]/vg/vggio/vggio.go:245:3: too many errors (exit status 2)
    

    I ran

    go get -u
    go mod tidy
    

    but the result stays the same.

    Maybe I did not consider certain version dependencies. At the same time, it seems that vggio is not compatible with the current version of gio, or that the above mentioned example file maybe is outdated. Is there any fix available for this?

  • No tick numbers on a log axis plots

    No tick numbers on a log axis plots

    What are you trying to do?

    Plot data with labels on a log-log plot. Sometimes, no tick numbers are being displayed (depending on the data).

    What did you do?

    See a full example at: https://gist.github.com/tdegris/d1844e7c209d77962ecc891b47d3a04a

    Summary:

    	p := plot.New()
            [...]
    	p.X.Scale = plot.LogScale{}
    	p.X.Tick.Marker = plot.LogTicks{}
    	p.Y.Scale = plot.LogScale{}
    	p.Y.Tick.Marker = plot.LogTicks{}
    	p.Add(&plotter.Line{
    		XYs: data,
    		LineStyle: draw.LineStyle{ [...] },
    	})
    

    What did you expect to happen?

    Some numbers on the ticks of the Y axis.

    What actually happened?

    No tick numbers on the Y axis.

    noylabels

    What version of Go and Gonum/plot are you using?

    go version:

    go version go1.18.3 darwin/arm64
    

    gonum/plot version:

    /opt/homebrew/opt/go/pkg/mod/gonum.org/v1                                                                                                                         
    $ git rev-parse HEAD
    fba051f98f609634ae4392d0053ddfc627f8cdb3
    
  • plot: Align doesn't exactly align axes

    plot: Align doesn't exactly align axes

    as can be noticed from the produced plot in #732, (even with the 1:1 ratio), axes are not exactly aligned between plots (Y-axis for top-left/bottom-left, X-axis for bottom-left/bottom-right): rotated-canvas

    I've tested that with release up to v0.7.0 (so it's not a fall out from the "fonts revamp" work.) rot-v0 7 0

  • plot: consider implementing a rotated/transformed canvas

    plot: consider implementing a rotated/transformed canvas

    this has come up on slack. it would be great to be able to implement this kind of plot:

    • https://matplotlib.org/stable/gallery/axes_grid1/scatter_hist_locatable_axes.html#sphx-glr-gallery-axes-grid1-scatter-hist-locatable-axes-py plot

    to achieve this sort of thing, we need to be able to rotate a plot to tack it on the right hand side of the bottom left plot.

    the following program is an attempt at reproducing the same plot (sans the rotated canvas).

    package main
    
    import (
    	"flag"
    	"image/color"
    	"log"
    	"math/rand"
    	"os"
    
    	"gonum.org/v1/plot"
    	"gonum.org/v1/plot/plotter"
    	"gonum.org/v1/plot/vg"
    	"gonum.org/v1/plot/vg/draw"
    	"gonum.org/v1/plot/vg/vgimg"
    )
    
    func main() {
    	var ratio = flag.Bool("ratio", false, "apply a 1/3 ratio")
    	flag.Parse()
    
    	const (
    		rows = 2
    		cols = 2
    	)
    
    	var blue = color.RGBA{R: 24, G: 90, B: 169, A: 255}
    
    	ps := make([][]*plot.Plot, rows)
    	for i := range ps {
    		ps[i] = make([]*plot.Plot, cols)
    		for j := range ps[i] {
    			if i == 0 && j == 1 {
    				continue
    			}
    			ps[i][j] = plot.New()
    		}
    	}
    
    	const N = 1000
    	rnd := rand.New(rand.NewSource(1))
    	data := make(plotter.XYs, N)
    	xs := make(plotter.Values, N)
    	ys := make(plotter.Values, N)
    	for i := range data {
    		xs[i] = rnd.NormFloat64() * 2
    		ys[i] = rnd.NormFloat64()
    		data[i].X = xs[i]
    		data[i].Y = ys[i]
    	}
    
    	s, err := plotter.NewScatter(data)
    	if err != nil {
    		log.Panic(err)
    	}
    	s.GlyphStyle.Color = blue
    	s.GlyphStyle.Radius = vg.Points(3)
    
    	ps[1][0].Add(s)
    
    	// histo-x
    	hx, err := plotter.NewHist(xs, 20)
    	if err != nil {
    		log.Panic(err)
    	}
    	hx.FillColor = blue
    	hx.LineStyle.Color = blue
    
    	ps[0][0].Add(hx)
    
    	// histo-y
    	hy, err := plotter.NewHist(ys, 20)
    	if err != nil {
    		log.Panic(err)
    	}
    	hy.FillColor = blue
    	hy.LineStyle.Color = blue
    
    	ps[1][1].Add(hy)
    
    	const (
    		xsize = 30 * vg.Centimeter
    		ysize = 30 * vg.Centimeter
    	)
    	img := vgimg.New(xsize, ysize)
    	dc := draw.New(img)
    
    	const padding = 0.2 * vg.Centimeter
    	t := draw.Tiles{
    		Rows:      rows,
    		Cols:      cols,
    		PadTop:    padding,
    		PadBottom: padding,
    		PadRight:  padding,
    		PadLeft:   padding,
    		PadX:      padding,
    		PadY:      padding,
    	}
    
    	cs := plot.Align(ps, t, dc)
    
    	// aspect ratio.
    	if *ratio {
    		var (
    			top = &cs[0][0]
    			mid = &cs[1][0]
    			rhs = &cs[1][1]
    		)
    		top.Rectangle.Min.Y += 0.6 * top.Rectangle.Size().Y
    		top.Rectangle.Max.X += 0.6 * top.Rectangle.Size().X
    
    		mid.Rectangle.Max.Y += 0.6 * mid.Rectangle.Size().Y
    		mid.Rectangle.Max.X += 0.6 * mid.Rectangle.Size().X
    
    		rhs.Rectangle.Max.Y += 0.6 * rhs.Rectangle.Size().Y
    		rhs.Rectangle.Min.X += 0.6 * rhs.Rectangle.Size().X
    	}
    
    	ps[0][0].X.Tick.Marker = NoTicks{}
    	ps[1][1].Y.Tick.Marker = NoTicks{}
    
    	for j := 0; j < rows; j++ {
    		for i := 0; i < cols; i++ {
    			if ps[j][i] == nil {
    				continue
    			}
    			ps[j][i].Draw(cs[j][i])
    		}
    	}
    
    	w, err := os.Create("rotated-canvas.png")
    	if err != nil {
    		panic(err)
    	}
    	defer w.Close()
    
    	png := vgimg.PngCanvas{Canvas: img}
    	if _, err := png.WriteTo(w); err != nil {
    		panic(err)
    	}
    }
    
    // NoTicks implements plot.Ticker but does not display any tick.
    type NoTicks struct{}
    
    // Ticks returns Ticks in a specified range
    func (NoTicks) Ticks(min, max float64) []plot.Tick {
    	return nil
    }
    

    rotated-canvas

  • plot: test glyphboxes for plain and latex handlers

    plot: test glyphboxes for plain and latex handlers

    working on https://github.com/gonum/plot/pull/708 uncovered a slew of bugs related to plot.GlyphBox{,er}. we should probably test more thoroughly the various modes in which plot.GlyphBoxes are involved:

    • [ ] with a text.Plain handler (the default)
    • [ ] with a text.Latex handler
    • [ ] with and without a plot.Plot.Title
    • [ ] with and without a plot.Plot.{X,Y}.Label
    • [ ] with and without rotated labels, title and legend entries (#722, #724)
    • [ ] with and without a centered plot.Plot.{X,Y}.Label (+ rotated or not?) (#723)
  • plot: glyphbox for Legend

    plot: glyphbox for Legend

    plot.Legend doesn't implement plot.GlyphBoxer. It probably should so we don't unadvertantly cut off some of its symbols or glyphs.

    one should check the display of testdata/legend_standalone_golden.png as noted in https://github.com/gonum/plot/pull/708#issuecomment-869558221.

PlotNG - plotting utility for Chia.Net

Squizit is a simple tool, that aim to help you get the grade you want, not the one you have learnt for.

Aug 5, 2022
HBase Exporter,fetch data from jmx for region-level data.

HBase Exporter Prometheus exporter for HBase which fetch data from hbase jmx, written in Go. You can even see region-level metrics. Installation and U

Nov 4, 2022
Ltree Visualizer - A golang library to visualize postgres ltree type data using DOT language and Graphviz

Ltree Visualizer A golang library to visualize postgres ltree type data using DOT language and Graphviz What is Ltree? Ltree is a data type which is u

Jun 12, 2022
Attempt to plot light sensor data from lunarsensor.

lightsensor Attempt to plot light sensor data from lunarsensor. Buy the components, install firmware on Ambient Light Sensor. Build the go app that po

Nov 10, 2022
Data visualization with chart, Create CSV file, Read Write CSV file

Data visualization with chart, Create CSV file, Read Write CSV file, Read from json file and many more in single project ......

Jan 13, 2022
Tool that can parse Go files into an abstract syntax tree and translate it to several programming languages.

GoDMT GoDMT, the one and only Go Data Model Translator. The goal of this project is to provide a tool that can parse Go files that include var, const,

Nov 28, 2022
Callgraph analysis and visualization for Go

Gocyto A Go SSA callgraph builder and visualizer, by @protolambda. Features: output to generic Cytoscape JSON format. (list of nodes, list of edges) o

Nov 3, 2022
Interactive Terraform visualization. State and configuration explorer.

Rover - Terraform Visualizer Rover is a Terraform visualizer. In order to do this, Rover: generates a plan file and parses the configuration in the ro

Jan 9, 2023
termdbms: A TUI for viewing and editing databases, written in Go
 termdbms: A TUI for viewing and editing databases, written in Go

termdbms: A TUI for viewing and editing databases, written in Go Database Support SQLite made with modernc.org/sqlite, charmbracelet/bubbletea, and c

Dec 26, 2022
A repository for plotting and visualizing data

gonum/plot is the new, official fork of code.google.com/p/plotinum. It provides an API for building and drawing plots in Go

Jan 5, 2023
A repository for plotting and visualizing data

Gonum Plot gonum/plot is the new, official fork of code.google.com/p/plotinum. It provides an API for building and drawing plots in Go. Note that this

Jun 3, 2021
Goal: Learn a Go plotting library and track my Electricity costs

Goal: Learn a Go plotting library and track my Electricity costs Findings https:

Jan 2, 2022
A brief demo of real-time plotting with Plotly, Go, and server-sent events

Golang SSE Demo A brief demo of real-time plotting with Plotly, Go, and server-side events. Overview I first learned about Server-Sent Events from @mr

Nov 28, 2022
PlotNG - plotting utility for Chia.Net

Squizit is a simple tool, that aim to help you get the grade you want, not the one you have learnt for.

Aug 5, 2022
Image - This repository holds supplementary Go image librariesThis repository holds supplementary Go image libraries

Go Images This repository holds supplementary Go image libraries. Download/Insta

Jan 5, 2022
This is the repository I made while learning Go Programming Language & You can follow this repository to learn it

Golang Arena ?? Hey Folks! Welcome to Golang Arena . This is the repository I made while learning Go Programming Language & You can follow this reposi

Jan 31, 2022
Optimus is an easy-to-use, reliable, and performant workflow orchestrator for data transformation, data modeling, pipelines, and data quality management.

Optimus Optimus is an easy-to-use, reliable, and performant workflow orchestrator for data transformation, data modeling, pipelines, and data quality

Jan 6, 2023
Prometheus Common Data Exporter can parse JSON, XML, yaml or other format data from various sources (such as HTTP response message, local file, TCP response message and UDP response message) into Prometheus metric data.

Prometheus Common Data Exporter Prometheus Common Data Exporter 用于将多种来源(如http响应报文、本地文件、TCP响应报文、UDP响应报文)的Json、xml、yaml或其它格式的数据,解析为Prometheus metric数据。

May 18, 2022
ArgoCD is widely used for enabling CD GitOps. ArgoCD internally builds manifest from source data in Git repository, and auto-sync it with target clusters.

ArgoCD Interlace ArgoCD is widely used for enabling CD GitOps. ArgoCD internally builds manifest from source data in Git repository, and auto-sync it

Dec 14, 2022
A seed repository that contains a Go project that accepts input via a REST API and saves data to an Oracle database.

rest-oracle-go-seed A seed repository that contains a Go project that accepts input via a REST API and saves data to an Oracle database. Why Oracle? T

Apr 18, 2022