Grafana Mimir provides horizontally scalable, highly available, multi-tenant, long-term storage for Prometheus.

Grafana Mimir

Grafana Mimir logo

Grafana Mimir is an open source software project that provides a scalable long-term storage for Prometheus. Some of the core strengths of Grafana Mimir include:

  • Easy to install and maintain: Grafana Mimir’s extensive documentation, tutorials, and deployment tooling make it quick to get started. Using its monolithic mode, you can get Grafana Mimir up and running with just one binary and no additional dependencies. Once deployed, the best-practice dashboards, alerts, and playbooks packaged with Grafana Mimir make it easy to monitor the health of the system.
  • Massive scalability: You can run Grafana Mimir's horizontally-scalable architecture across multiple machines, resulting in the ability to process orders of magnitude more time series than a single Prometheus instance. Internal testing shows that Grafana Mimir handles up to 1 billion active time series.
  • Global view of metrics: Grafana Mimir enables you to run queries that aggregate series from multiple Prometheus instances, giving you a global view of your systems. Its query engine extensively parallelizes query execution, so that even the highest-cardinality queries complete with blazing speed.
  • Cheap, durable metric storage: Grafana Mimir uses object storage for long-term data storage, allowing it to take advantage of this ubiquitous, cost-effective, high-durability technology. It is compatible with multiple object store implementations, including AWS S3, Google Cloud Storage, Azure Blob Storage, OpenStack Swift, as well as any S3-compatible object storage.
  • High availability: Grafana Mimir replicates incoming metrics, ensuring that no data is lost in the event of machine failure. Its horizontally scalable architecture also means that it can be restarted, upgraded, or downgraded with zero downtime, which means no interruptions to metrics ingestion or querying.
  • Natively multi-tenant: Grafana Mimir’s multi-tenant architecture enables you to isolate data and queries from independent teams or business units, making it possible for these groups to share the same cluster. Advanced limits and quality-of-service controls ensure that capacity is shared fairly among tenants.

Migrating to Grafana Mimir

If you're migrating to Grafana Mimir, refer to the following documents:

Deploying Grafana Mimir

For information about how to deploy Grafana Mimir, refer to Deploying Grafana Mimir.

Getting started

If you’re new to Grafana Mimir, read the Getting started guide.

Before deploying Grafana Mimir in a production environment, read:

  1. An overview of Grafana Mimir’s architecture
  2. Configuring Grafana Mimir
  3. Running Grafana Mimir in production

Documentation

Refer to the following links to access Grafana Mimir documentation:

Contributing

To contribute to Grafana Mimir, refer to Contributing to Grafana Mimir.

Join the Grafana Mimir discussion

If you have any questions or feedback regarding Grafana Mimir, join the Grafana Mimir Discussion. Alternatively, consider joining the monthly Grafana Mimir Community Call.

Your feedback is always welcome, and you can also share it via the #mimir Slack channel.

License

Grafana Mimir is distributed under AGPL-3.0-only.
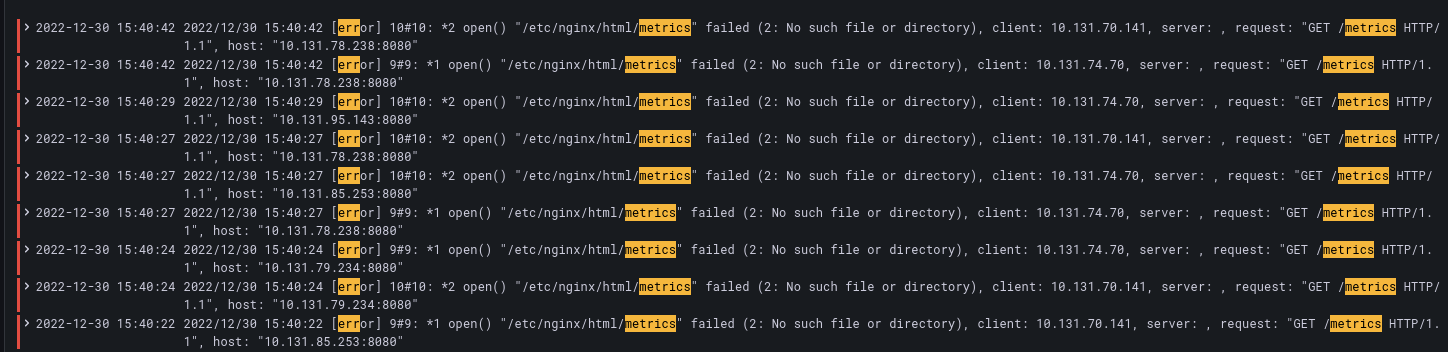
Owner
Grafana Labs
Grafana Labs is behind leading open source projects Grafana and Loki, and the creator of the first open & composable observability platform.
Grafana Labs
Comments
  • Support for rollout-operator and Zone Awareness

    Support for rollout-operator and Zone Awareness

    What this PR does

    For the record: the original PR this is based on was authored by @ryan-dyer-sp , see #2437

    Replication zone support for alertmanager, ingester, store-gateway component Including migration path, tests and documentation.

    The migration is written in a way so that:

    1. step sets the final configuration in the Mimir YAML configuration
    • this means it can be validated right at the start
    • subsequent steps alter CLI options , only restart what's necessary
    1. steps are using named toggles, I realized that a single number would be too hard for us to maintain.

    Which issue(s) this PR fixes or relates to

    Fixes #2020

    Checklist

    • [ ] Tests updated
    • [x] Documentation added
    • [x] CHANGELOG.md updated - the order of entries should be [CHANGE], [FEATURE], [ENHANCEMENT], [BUGFIX]
  • Add compactor HTTP API for uploading TSDB blocks

    Add compactor HTTP API for uploading TSDB blocks

    What this PR does

    Add compactor HTTP API for uploading TSDB blocks.

    TODOs

    • [x] Add HTTP endpoints in cloud gateway
    • [x] Add HTTP endpoints in GEM gateway
    • [x] Incorporate @pracucci's feedback
    • [x] Add tests
    • [x] Add validation when creating a block upload session
    • [x] Validate block metadata
    • [x] Validate block files(?) (@colega suggestion)
    • [x] Make sure that when starting a backfill, file lengths are sent with file index
    • [x] Validate that block time range is within retention period (@aldernero working on this)
    • [x] Validate minTime/maxTime in meta.json (@aldernero working on this)
    • [x] Validate block ID on backfill start
    • [x] Test output from sanitizeMeta
    • [x] Mark user-uploaded blocks, for debugging and security(?) (this is in place through thanos.source property in meta.json)
    • [x] Make sure that a backfill can be restarted, in case it got interrupted
    • [x] Add/fix tests

    Which issue(s) this PR fixes or relates to

    Checklist

    • [x] Tests updated
    • [x] Documentation added
    • [x] CHANGELOG.md updated - the order of entries should be [CHANGE], [FEATURE], [ENHANCEMENT], [BUGFIX]
  • Fix panic in distributor due to early cleanup

    Fix panic in distributor due to early cleanup

    Fixes: https://github.com/grafana/mimir/issues/2266

    Edit 2022-07-22: Most of the code in pkg/distributor/forwarding has been re-written so looking at the diff between the old and the new code is probably not very helpful when reviewing, I recommend looking at the new implementation as if it were completely new.

    In a conversation via DMs with @bboreham we concluded that it would be better to keep the forwarding logic as isolated from the distributor's PushWithCleanup() as possible, this should help to ensure that there are no race conditions or pool usage bugs.

  • Add a docker-compose local setup to fully test Mimir

    Add a docker-compose local setup to fully test Mimir

    What this PR does: In this PR I propose to introduce a docker-compose local setup (based on single binary and memberlist) to allow the community to have a quick way to try the latest stable release of Mimir in a HA setup. It also runs Prometheus (used both to scrape Mimir metrics and run recording rules) as well as Grafana with our dashboard provisioned.

    The PR includes a tutorial-style README.md guiding the user step-by-step. I've try to follow the Grafana tutorial style, but I haven't used tutorial markdown syntax given for the moment won't be published as a Grafana tutorial.

    Which issue(s) this PR fixes: Fixes #991 Fixes #1024

    Checklist

    • [ ] Tests updated
    • [ ] Documentation added
    • [ ] CHANGELOG.md updated - the order of entries should be [CHANGE], [FEATURE], [ENHANCEMENT], [BUGFIX]
  • Runtime override of tenant-specific active series custom trackers

    Runtime override of tenant-specific active series custom trackers

    What this PR does

    This PR moves the active series custom trackers to a runtime configuration, and also introduces tenant-specific overwrites for these matchers. I am uploading this to start an early discussion of the design,

    Key points I would already like to discuss:

    • ~~Moving the custom trackers to runtime configuration is a breaking change as it removes the flag and changes the default behavior~~
    • Config change management could be better handled on manager side, with some content hashing, but that would introduce dskit changes...

    Which issue(s) this PR fixes

    https://github.com/grafana/mimir-squad/issues/526

    Fixes #

    Checklist

    • [x] Tests updated
    • [x] Documentation added
    • [x] CHANGELOG.md updated - the order of entries should be [CHANGE], [FEATURE], [ENHANCEMENT], [BUGFIX]
  • Fix makefiles in development folder to properly check yml in CI/CD

    Fix makefiles in development folder to properly check yml in CI/CD

    What this PR does

    Fixes this problem: currently, you can modify the docker-compose.yml directly (which is supposed to be generated) without modifying the docker-compose.jsonnet template and have it still pass the CI/CD tests, which doesn't seem to be intended, because of this issue https://stackoverflow.com/questions/3931741/why-does-make-think-the-target-is-up-to-date where if the make command name is the same as the name of a file in that folder that already exists, it does not regenerate it and hence does not notice that the file has changed. So we use .PHONY to ensure that make check in our CI/CD will actually regenerate the file properly.

    Which issue(s) this PR fixes or relates to

    N/A. CI/CD issue only, doesn't affect users

    Checklist

    • [x] Tests updated
    • [x] Documentation added
    • [x] CHANGELOG.md updated - the order of entries should be [CHANGE], [FEATURE], [ENHANCEMENT], [BUGFIX]
  • track sample OOO/wallclock delay in histogram

    track sample OOO/wallclock delay in histogram

    This should help with building an understanding of customer requirements as far as how far back in time (wrt walclock, and wrt the sample with highest timestamp seen) samples tend to go. This whole codebase is pretty new to me, so want to check if this makes sense... Note that we don't track per-tenantID as that would be expensive and I don't think we need to. cc @codesome

    Note: changes are in mimir and also in vendored prometheus. For now I made the change in vendor dir directly (hence the CI failure), but if we want to take this forward, it will be done properly.

    Checklist

    • [ ] Tests updated
    • [ ] Documentation added
    • [ ] CHANGELOG.md updated - the order of entries should be [CHANGE], [FEATURE], [ENHANCEMENT], [BUGFIX]
  • Add alertmanager fallback config in Helm chart

    Add alertmanager fallback config in Helm chart

    What this PR does

    Adds the possibility to define a fallback config for alertmanager from the helm chart config

    Checklist

    • [x] Tests updated
    • [ ] Documentation added
    • [x] CHANGELOG.md updated - the order of entries should be [CHANGE], [FEATURE], [ENHANCEMENT], [BUGFIX]
  • Automate release process

    Automate release process

    In preparation of Mimir launch, we need to automate the release process:

    • [x] Build binaries (+ checksums)
    • [x] Build and push Docker images to docker.io
    • [x] https://github.com/grafana/mimir/issues/837
    • [x] https://github.com/grafana/mimir/pull/975
    • [x] https://github.com/grafana/mimir/pull/1138
    • [x] Push all Mimir images (including tools and build image) to docker.io/grafana/*
    • [x] Revise RELEASE.md
      • [x] Release schedule: should be removed, it was from Cortex
      • [x] Change Cortex->Mimir
      • [x] Ensure release procedure is up to date
      • [x] Decide how to tag release, start at v2.0.0 -> design doc

    Out of scope:

    • publishing docs to the grafana.com website (tracked in another issue - cc @jdbaldry can you fill in the issue please?)
    • rpm, deb, homebrew packages (in fact, get rid of any leftovers in makefile and elsewhere)
    • automating upload of binaries
  • Slow integration tests caused by slow update of ring client metrics

    Slow integration tests caused by slow update of ring client metrics

    While investigating slow integration tests I've noticed that some of them (eg. TestSingleBinaryWithMemberlist) is significantly slowed down by assertions ring metrics, like this one:

    require.NoError(t, s.Stop(mimir1))
    require.NoError(t, mimir2.WaitSumMetrics(e2e.Equals(2*512), "cortex_ring_tokens_total"))
    

    Why? Because the ring client updates the metrics every 10s (hardcoded): https://github.com/grafana/dskit/blob/84c00dae89477871dbfa0b83c823c7258f53e3bd/ring/ring.go#L288-L302

    This means that every time there's a ring change (eg. s.Step(mimir1)) and then we wait for that change to be propagated (eg. mimir2.WaitSumMetrics(e2e.Equals(2*512), "cortex_ring_tokens_total")) we end up waiting up to 10s after the change has been propagated just because client metrics are not updated right after the update has been received by the ring client.

    The regression has been introduced in dskit PR 50.

  • `markblocks` tool to mark blocks for deletion or as non-compactable

    `markblocks` tool to mark blocks for deletion or as non-compactable

    What this PR does

    I think we should have this committed in the repo rather than having to look for it in issue comments.

    Which issue(s) this PR fixes or relates to

    Ref: https://github.com/grafana/mimir/issues/1537

    Checklist

    • [ ] Tests updated
    • [x] Documentation added
    • [x] CHANGELOG.md updated - the order of entries should be [CHANGE], [FEATURE], [ENHANCEMENT], [BUGFIX]
  • [Helm][v4.0.0] Gateway component doesn't have `/metrics` endpoint

    [Helm][v4.0.0] Gateway component doesn't have `/metrics` endpoint

    Describe the bug

    After deploying mimir-distributed version 4.0.0

    image

    To Reproduce

    Steps to reproduce the behavior:

    helm repo add prometheus-community https://prometheus-community.github.io/helm-charts
    helm repo add grafana https://grafana.github.io/helm-charts
    helm repo update
    
    helm upgrade --install prometheus-operator prometheus-community/kube-prometheus-stack
    helm fetch --untar grafana/mimir-distributed --version 4.0.0
    helm upgrade --install mimir ./mimir-distributed \
      -f ./mimir-distributed/values.yaml \
      -f ./mimir-distributed/large.yaml
    

    Expected behavior

    Either be able to disable the ServiceMonitor for the gateway or add the /metrics endpoint as expected (see workaround below)

    Environment

    • Infrastructure: AWS EKS
    • Deployment tool: Helm

    Additional Context

    My workaround has been to add nginx-prometheus-exporter as sidecar

    gateway:
      enabledNonEnterprise: true
      extraContainers:
      - args:
        - -nginx.retries=5
        - -nginx.scrape-uri=http://127.0.0.1:8080/nginx_status
        - -web.telemetry-path=/metrics
        - -web.listen-address=:9113
        image: nginx/nginx-prometheus-exporter:0.11.0
        name: nginx-exporter
        resources:
          requests:
            cpu: 20m
            memory: 32Mi
      nginx:
        config:
          serverSnippet: |
            location = /metrics {
              proxy_pass http://127.0.0.1:9113$request_uri;
              auth_basic off;
            }
            location = /nginx_status {
              stub_status;
              auth_basic off;
            }
        verboseLogging: false
      podDisruptionBudget:
        maxUnavailable: 50%
      replicas: 5
      resources: {}


    image

  • Make query-frontend cache TTL configurable, and increase the default.

    Make query-frontend cache TTL configurable, and increase the default.

    Is your feature request related to a problem? Please describe.

    query-frontend caches results, but it sets a TTL of 7d to those results:

    https://github.com/grafana/mimir/blob/cac269d4837e168b3b3f17b7e2e56cdacd79c4c7/pkg/frontend/querymiddleware/split_and_cache.go#L37-L38

    If you're caching a year-long query, it means that you'll have to recalculate it next week again, which is undesirable.

    Describe the solution you'd like

    Make the TTL configurlable, allow no TTL at all (Memcache is LRU, why caring about TTL?)

    Note that the maximum TTL for Memcache appears to be 30d.

  • Docs: Introduce dedicated reference section for config parameters

    Docs: Introduce dedicated reference section for config parameters

    What this PR does

    This moves the configuration parameter reference from a sub-sub-sub page to a dedicated top-level section where it stands out more and is easier to access (imho) for someone not very familiar with the structure of the documentation.

    It also adds the --init flag to the docker run command that serves docs locally. At least on my system, this was necessary to make the container shut down on Ctrl+C as advertised.

    Which issue(s) this PR fixes or relates to

    n/a

    Checklist

    • [ ] Tests updated
    • [ ] Documentation added
    • [ ] CHANGELOG.md updated - the order of entries should be [CHANGE], [FEATURE], [ENHANCEMENT], [BUGFIX]
  • Helm 4.0.0 Gateway nginx config is not working with zone-aware alertmanager configuration (mimir oss)

    Helm 4.0.0 Gateway nginx config is not working with zone-aware alertmanager configuration (mimir oss)

    Describe the bug

    Helm 4.0.0 Gateway nginx config is not working with zone-aware alertmanager configuration (mimir oss)

    To Reproduce

    Steps to reproduce the behavior:

    1. Install mimir-distributed version 3.3.x
    2. Upgrade to mimir-distributed version 4.0.0 with zone-aware configuration disabled
    3. Migrate to unify proxy deplouyment using following procedure https://grafana.com/docs/mimir/v2.5.x/operators-guide/deploy-grafana-mimir/migrate-to-unified-proxy-deployment/
    4. Migrate alertmanager single zone to zone-aware replication using following procedure https://grafana.com/docs/mimir/latest/migration-guide/migrating-from-single-zone-with-helm/

    Expected behavior

    Expect the alert manager to be available through the gateway configuration but it is not.

    The problem is that the gateway nginx.conf is not correct. The service "mimir-alertmanager" has been replaced by "mimir-alertmanager-zone-a", "mimir-alertmanager-zone-b" and "mimir-alertmanager-zone-c"

    
        # Alertmanager endpoints
    
        location /alertmanager {
    
          proxy_pass      http://mimir-alertmanager.mimir.svc.cluster.local:8080$request_uri;
    
        }
    
        location = /multitenant_alertmanager/status {
    
          proxy_pass      http://mimir-alertmanager.mimir.svc.cluster.local:8080$request_uri;
    
        }
    
        location = /api/v1/alerts {
    
          proxy_pass      http://mimir-alertmanager.mimir.svc.cluster.local:8080$request_uri;
    
        }
    

    resolution proposal

    change the gateway nginx.conf (see: https://github.com/grafana/mimir/blob/mimir-distributed-4.0.0/operations/helm/charts/mimir-distributed/values.yaml#L2485) to have something like that

    
        # Alertmanager endpoints
    
        location /alertmanager {
    
          proxy_pass      http://mimir-alertmanager-headless.mimir.svc.cluster.local:8080$request_uri;
    
        }
    
        location = /multitenant_alertmanager/status {
    
          proxy_pass      http://mimir-alertmanager-headless.mimir.svc.cluster.local:8080$request_uri;
    
        }
    
        location = /api/v1/alerts {
    
          proxy_pass      http://mimir-alertmanager-headless.mimir.svc.cluster.local:8080$request_uri;
    
        }
    
  • Alerts: Add alert that triggers for idle alertmanager instances

    Alerts: Add alert that triggers for idle alertmanager instances

    What this PR does

    This adds an alert to detect alertmanager instances that don't own any tenants.

    Which issue(s) this PR fixes or relates to

    Fixes #1959

    Checklist

    • [ ] Tests updated
    • [x] Documentation added
    • [x] CHANGELOG.md updated - the order of entries should be [CHANGE], [FEATURE], [ENHANCEMENT], [BUGFIX]
  • Introduce querier.max-partial-query-length flag

    Introduce querier.max-partial-query-length flag

    What this PR does

    This introduces the querier.max-partial-query-length flag to allow limiting the time range for (partial) queries at the querier level. It also deprecates store.max-query-length which became ambiguous due to its different semantics in limiting query ranges at the frontend and querier levels.

    Which issue(s) this PR fixes or relates to

    Fixes #2793

    Checklist

    • [x] Tests updated
    • [ ] Documentation added
    • [x] CHANGELOG.md updated - the order of entries should be [CHANGE], [FEATURE], [ENHANCEMENT], [BUGFIX]
A set of components that can be composed into a highly available metric system with unlimited storage capacity

Overview Thanos is a set of components that can be composed into a highly available metric system with unlimited storage capacity, which can be added

Oct 20, 2021
TiDB Mesh: Implement Multi-Tenant Keyspace by Decorating Message between Components

TiDB Mesh: Implement Multi-Tenant Keyspace by Decorating Message between Compone

Jan 11, 2022
grafana-sync Keep your grafana dashboards in sync.

grafana-sync Keep your grafana dashboards in sync. Table of Contents grafana-sync Table of Contents Installing Getting Started Pull Save all dashboard

Dec 14, 2022
Snowflake grafana datasource plugin allows Snowflake data to be visually represented in Grafana dashboards.

Snowflake Grafana Data Source With the Snowflake plugin, you can visualize your Snowflake data in Grafana and build awesome chart. Get started with th

Dec 29, 2022
A Grafana backend plugin for automatic synchronization of dashboard between multiple Grafana instances.

Grafana Dashboard Synchronization Backend Plugin A Grafana backend plugin for automatic synchronization of dashboard between multiple Grafana instance

Dec 23, 2022
Terraform-grafana-dashboard - Grafana dashboard Terraform module

terraform-grafana-dashboard terraform-grafana-dashboard for project Requirements

May 2, 2022
Grafana-threema-forwarder - Alert forwarder from Grafana webhooks to Threema wire messages

Grafana to Threema alert forwarder Although Grafana has built in support for pus

Nov 11, 2022
Andrews-monitor - A Go program to monitor when times were available to order for Brown's Andrews dining hall. Used during the portion of the pandemic when the dining hall was only available for online order.

Andrews Dining Hall Monitor A Go program to monitor when times were available to order for Brown's Andrews dining hall. Used during the portion of the

Jan 1, 2022
Openshift's hpessa-exporter allows users to export SMART information of local storage devices as Prometheus metrics, by using HPE Smart Storage Administrator tool

hpessa-exporter Overview Openshift's hpessa-exporter allows users to export SMART information of local storage devices as Prometheus metrics, by using

Jan 17, 2022
The Container Storage Interface (CSI) Driver for Fortress Block Storage This driver allows you to use Fortress Block Storage with your container orchestrator

fortress-csi The Container Storage Interface (CSI) Driver for Fortress Block Storage This driver allows you to use Fortress Block Storage with your co

Jan 23, 2022
Otus prometheus grafana for golang

HW Prometheus. Grafana Clone the repo: git clone https://github.com/alikhanmurzayev/otus_kuber_part_3.git && cd otus_kuber_part_3 Prepare workspace: m

Dec 17, 2021
Flux prometheus grafana-example - A tool for keeping Kubernetes clusters in sync with sources ofconfiguration

Flux is a tool for keeping Kubernetes clusters in sync with sources of configuration (like Git repositories), and automating updates to configuration when there is new code to deploy.

Feb 1, 2022
PolarDB Stack is a DBaaS implementation for PolarDB-for-Postgres, as an operator creates and manages PolarDB/PostgreSQL clusters running in Kubernetes. It provides re-construct, failover swtich-over, scale up/out, high-available capabilities for each clusters.

PolarDB Stack开源版生命周期 1 系统概述 PolarDB是阿里云自研的云原生关系型数据库,采用了基于Shared-Storage的存储计算分离架构。数据库由传统的Share-Nothing,转变成了Shared-Storage架构。由原来的N份计算+N份存储,转变成了N份计算+1份存储

Nov 8, 2022
Open, Multi-Cloud, Multi-Cluster Kubernetes Orchestration

Karmada Karmada: Open, Multi-Cloud, Multi-Cluster Kubernetes Orchestration Karmada (Kubernetes Armada) is a Kubernetes management system that enables

Dec 30, 2022
Go WhatsApp Multi-Device Implementation in REST API with Multi-Session/Account Support

Go WhatsApp Multi-Device Implementation in REST API This repository contains example of implementation go.mau.fi/whatsmeow package with Multi-Session/

Dec 3, 2022
Export Prometheus metrics from journald events using Prometheus Go client library

journald parser and Prometheus exporter Export Prometheus metrics from journald events using Prometheus Go client library. For demonstration purposes,

Jan 3, 2022
SMART information of local storage devices as Prometheus metrics

hpessa-exporter Overview Openshift's hpessa-exporter allows users to export SMART information of local storage devices as Prometheus metrics, by using

Feb 10, 2022
Orchestra is a library to manage long running go processes.

Orchestra Orchestra is a library to manage long running go processes. At the heart of the library is an interface called Player // Player is a long ru

Oct 21, 2022
A long-running Go program that watches a Youtube playlist for new videos, and downloads them using yt-dlp or other preferred tool.

ytdlwatch A long-running Go program that watches a Youtube playlist for new videos, and downloads them using yt-dlp or other preferred tool. Ideal for

Jul 25, 2022