Go package to make lightweight ASCII line graph ╭┈╯ in command line apps with no other dependencies.

asciigraph

Build status Go Report Card Coverage Status GoDoc License Mentioned in Awesome Go

Go package to make lightweight ASCII line graphs ╭┈╯.

image

Installation

go get github.com/guptarohit/asciigraph

Usage

Basic graph

package main

import (
    "fmt"
    "github.com/guptarohit/asciigraph"
)

func main() {
    data := []float64{3, 4, 9, 6, 2, 4, 5, 8, 5, 10, 2, 7, 2, 5, 6}
    graph := asciigraph.Plot(data)

    fmt.Println(graph)
}

Running this example would render the following graph:

  10.00 ┤        ╭╮
   9.00 ┤ ╭╮     ││
   8.00 ┤ ││   ╭╮││
   7.00 ┤ ││   ││││╭╮
   6.00 ┤ │╰╮  ││││││ ╭
   5.00 ┤ │ │ ╭╯╰╯│││╭╯
   4.00 ┤╭╯ │╭╯   ││││
   3.00 ┼╯  ││    ││││
   2.00 ┤   ╰╯    ╰╯╰╯

Command line interface

This package also brings a small utility for command line usage. Assuming $GOPATH/bin is in your $PATH, simply go get it then install CLI.

CLI Installation

go install github.com/guptarohit/asciigraph/cmd/asciigraph

or download binaries from the releases page.

Feed it data points via stdin:

$ seq 1 72 | asciigraph -h 10 -c "plot data from stdin"
  72.00 ┼
  65.55 ┤                                                                  ╭────
  59.09 ┤                                                           ╭──────╯
  52.64 ┤                                                    ╭──────╯
  46.18 ┤                                             ╭──────╯
  39.73 ┤                                      ╭──────╯
  33.27 ┤                              ╭───────╯
  26.82 ┤                       ╭──────╯
  20.36 ┤                ╭──────╯
  13.91 ┤         ╭──────╯
   7.45 ┤  ╭──────╯
   1.00 ┼──╯
           plot data from stdin

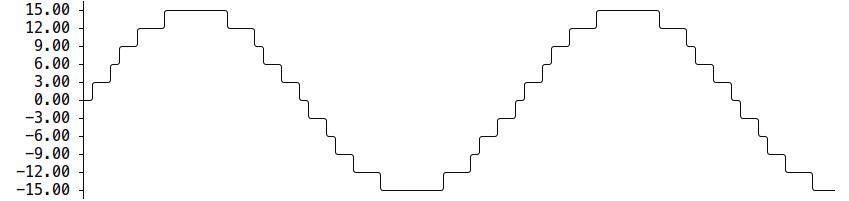
Realtime graph for data points via stdin:

$ ping -i.2 google.com | grep -oP '(?<=time=).*(?=ms)' --line-buffered | asciigraph -r -h 10 -w 40 -c "realtime plot data (google ping in ms) from stdin"

asciinema

Acknowledgement

This package started as golang port of asciichart.

Contributing

Feel free to make a pull request! :octocat:

Comments
  • Ansi colors

    Ansi colors

    Colors! This branch also includes my changes in #34 since colors are particularly useful for differentiating between different series in the same plot. AnsiRainbow

  • Remove append()

    Remove append()

    This added a bit of performance

    BenchmarkPlotOld 2058 557990 ns/op 213007 B/op 1200 allocs/op BenchmarkPlotNew 3272 367223 ns/op 105121 B/op 532 allocs/op

  • Panic when no positive values provided

    Panic when no positive values provided

    When no positive floats are provided to Plot(), a panic is observed:

    Examples:

    package main
    
    import "github.com/guptarohit/asciigraph"
    
    func main() {
    	println(asciigraph.Plot([]float64{0}))
    }
    
    package main
    
    import "github.com/guptarohit/asciigraph"
    
    func main() {
    	println(asciigraph.Plot([]float64{-1}))
    }
    

    Result:

    PS C:\Users\Lee\test> go run .\main.go
    panic: runtime error: index out of range
    
    goroutine 1 [running]:
    github.com/guptarohit/asciigraph.Plot(0xc00007df78, 0x1, 0x1, 0x0, 0x0, 0x0, 0x0, 0x0)
            C:/Users/Lee/go/pkg/mod/github.com/guptarohit/[email protected]/asciigraph.go:92 +0x13aa
    main.main()
            C:/Users/Lee/test/main.go:6 +0x67
    exit status 2
    

    Line 92 is as follows:

    plot[rows-y0][config.Offset-1] = "┼" // first value
    
  • fixed the BADPREC issue when both the maximum and minimum values in a series are 0

    fixed the BADPREC issue when both the maximum and minimum values in a series are 0

    Currently, if each value of a series is 0, here are the test code, this PR can fix the issue and avoid if the series's value is always 0.

    package main
    
    import (
        "fmt"
        "github.com/guptarohit/asciigraph"
    )
    
    func main() {
        data := []float64{0, 0, 0, 0, 0, 0, 0, 0, 0, 0, 0}
        graph := asciigraph.Plot(data)
    
        fmt.Println(graph)
    }
    

    Output:

    %!(BADPREC)            0.000000 ┼──────────


  • Prevent panics when data is flat

    Prevent panics when data is flat

    This avoids division by 0 that occurs when the incoming data is all one value. Instead of panicing, Plot should now plot flat data as expected, in a flat line.

  • Axis cross (┼) is in the wrong place at some scales

    Axis cross (┼) is in the wrong place at some scales

    For some inputs and at certain scales, the axis cross doesn't line up with the plotted data: screen shot 2019-02-02 at 2 37 29 pm

    I can reproduce this with the following inputs:

    echo '3084
    3056
    3047
    3043
    3041
    3043
    3043
    3036
    3033
    3042
    3042
    3040
    3032
    3039
    3018
    2925
    2926
    2925
    2923
    2922
    2924
    2920
    2910
    2906
    2907
    2908
    2908
    2908
    2908
    2917
    2914
    2911
    2914
    2909
    2913
    2910
    2914
    2915
    2894
    2915
    2913
    2915
    2907
    2908
    2916
    2911
    2910
    2912
    2903
    2914
    2911
    2905
    2903
    2901
    2910
    2899
    2901
    2901
    2902
    2909
    2904
    2908
    2893
    2901
    2903
    2903
    2908
    2910
    2900
    2898
    2903
    2895' | asciigraph -h 24
    
  • Plot multiple series together

    Plot multiple series together

    Display multiple series in the same plot, just like the original ported project supports.

     20 ┤                               ╭───────╭╮───────╮
     19 ┤                        ╭──╭───╭───────╭╮───────╮───╮──╮
     18 ┤                    ╭─╭──╭─╭───╭───────╭╮───────╮───╮─╮──╮─╮
     17 ┤                 ╭─╭─╭─╭─╭──╭──────────╯╰──────────╮──╮─╮─╮─╮─╮
     16 ┤              ╭─╭─╭╭─╭─╭────╯                      ╰────╮─╮─╮╮─╮─╮
     15 ┤            ╭╭─╭─╭╭─╭──╯                                ╰──╮─╮╮─╮─╮╮
     14 ┤          ╭╭─╭╭─╭╭──╯                                      ╰──╮╮─╮╮─╮╮
     13 ┤        ╭─╭╭╭─╭╭─╯                                            ╰─╮╮─╮╮╮─╮
     12 ┤       ╭╭╭─╭╭╭─╯                                                ╰─╮╮╮─╮╮╮
     11 ┤     ╭─╭╭╭╭╭─╯                                                    ╰─╮╮╮╮╮─╮
     10 ┤    ╭╭─╭╭╭╭╯                                                        ╰╮╮╮╮─╮╮
      9 ┤   ╭╭╯╭╭╭╭╯                                                          ╰╮╮╮╮╰╮╮
      8 ┤  ╭╭╯╭╭╭╭╯                                                            ╰╮╮╮╮╰╮╮
      7 ┤  ││╭╭╭╭╯                                                              ╰╮╮╮╮││
      6 ┤ ╭╭╭╭╭╭╯                                                                ╰╮╮╮╮╮╮
      5 ┤ ││││││                                                                  ││││││
      4 ┤╭╭╭╭╭╭╯                                                                  ╰╮╮╮╮╮╮
      3 ┤││││││                                                                    ││││││
      2 ┤││││││                                                                    ││││││
      1 ┤││││││                                                                    ││││││
      0 ┼╶╶╶╶╶╯                                                                    ╰╴╴╴╴╴
    
  • Remove append

    Remove append

    This added a bit of performance

    BenchmarkPlotOld 2058 557990 ns/op 213007 B/op 1200 allocs/op BenchmarkPlotNew 3272 367223 ns/op 105121 B/op 532 allocs/op

  • NaN numbers

    NaN numbers

    It would be great it the library can accept NaN float64 values. It can simply create a discontinuity in the the graph. Currently I have to do a validation to prevent the package from panicking.

  • Can I plot bar graphs?

    Can I plot bar graphs?

    I would like to know if I could use this library for plotting bar graphs. I could not find any examples that show bar plot using this library.

    Thanks.

  • Panics if data is flat

    Panics if data is flat

    If each data point in the input is the same, asciigraph panics. This can be demonstrated simply using the command line interface:

    > echo 1 1 | asciigraph
    panic: runtime error: index out of range
    
    goroutine 1 [running]:
    github.com/guptarohit/asciigraph.Plot(0xc420057c18, 0x2, 0x40, 0xc420057eb8, 0x4, 0x4, 0x17, 0x115f6c0)
            /home/me/go/src/github.com/guptarohit/asciigraph/asciigraph.go:92 +0x1525
    main.main()
            /home/me/go/src/github.com/guptarohit/asciigraph/cmd/asciigraph/main.go:56 +0x5e0
    

    I've also written a test that demonstrates it: https://github.com/xordspar0/asciigraph/commit/f02e7a51539d4db8dff95971007e1b208e30ff41

  • Data offset

    Data offset

    With this PR you can add offset for the data, where render of the graph is start, so you can add some big value as first column, which going to render as Y axel labels, but not in graph. I am going to this in case, where i like to see the graph very straight if changes are small, but in bigger changes should be drawn.

  • Two options: ColorAbove and ColorBelow

    Two options: ColorAbove and ColorBelow

    Hi.

    I've added some code to enable options to color the parts of the graph that is above/below a certain value. So this graph: bilde

    Is produced by the following code:

    func main() {
    	series := []float64{1, 2, 3, 4, 5, 4, 3, 2, 1}
    	graph := asciigraph.Plot(series, asciigraph.Height(10),
    		asciigraph.Width(50),
    		asciigraph.Caption("A simple line graph"),
    		asciigraph.ColorAbove(asciigraph.Red, 4.0),
    		asciigraph.ColorBelow(asciigraph.DarkGreen, 2.0),
    	)
    	fmt.Println(graph)
    }
    

    Lemme know if you want me to contribute this in a proper manner. If so I'll but a bow on it and hand it over.

    Cheers,

    Per.

  • Confused about the Offset option

    Confused about the Offset option

    I'm a bit confused about the meaning of the Offset option.

    for i := 0; i < 10; i++ {
    	println("offset", i, ":", Plot([]float64{0}, Offset(i)))
    }
    
    offset 0 :  0.00 ┼
    offset 1 : ┼
    offset 2 :  0.00┼
    offset 3 :  0.00 ┼
    offset 4 :  0.00  ┼
    offset 5 :  0.00   ┼
    offset 6 :   0.00   ┼
    offset 7 :    0.00   ┼
    offset 8 :     0.00   ┼
    offset 9 :      0.00   ┼
    

    This is pretty odd behavior that raises a few questions. Is the purpose of this option to add space before or after the y-axis label? It seems to do a bit of both in an inconsistent way.

  • Print X-Axis values

    Print X-Axis values

    Hi there, pretty awesome lib!

    How complex would it be to add an option to print the x-axis in addition to the y-axis? I want to use your library in my fan2go project to print fan curve data to console, and it would be very helpful for users to see the x-axis values (0-255).

    Thx!

  • Code reformat

    Code reformat

    Following PR fixes issue mentioned in #18. I implemented Graph struct with it's methods and implemented already written Plot() function to use Graph struct

A go library to improve readability in terminal apps using tabular data

uitable uitable is a go library for representing data as tables for terminal applications. It provides primitives for sizing and wrapping columns to i

Dec 30, 2022
Intuitive package for prettifying terminal/console output. http://godoc.org/github.com/ttacon/chalk

chalk Chalk is a go package for styling console/terminal output. Check out godoc for some example usage: http://godoc.org/github.com/ttacon/chalk The

Dec 23, 2022
An ANSI colour terminal package for Go

colourize An ANSI colour terminal package for Go. Supports all ANSI colours and emphasis. Not compatible with Windows systems. Installation go get gi

Sep 26, 2022
Minimalist Go package aimed at creating Console User Interfaces.

GOCUI - Go Console User Interface Minimalist Go package aimed at creating Console User Interfaces. Features Minimalist API. Views (the "windows" in th

Dec 25, 2022
Go package to make lightweight ASCII line graph ╭┈╯ in command line apps with no other dependencies.

asciigraph Go package to make lightweight ASCII line graphs ╭┈╯. Installation go get github.com/guptarohit/asciigraph Usage Basic graph package main

Jan 8, 2023
asciigrid is a Go package that implements decoder and encoder for the Esri ASCII grid format, also known as ARC/INFO ASCII GRID.

asciigrid asciigrid is a Go package that implements decoder and encoder for the Esri ASCII grid format, also known as ARC/INFO ASCII GRID. Install go

Jul 3, 2022
CLI client (and Golang module) for deps.dev API. Free access to dependencies, licenses, advisories, and other critical health and security signals for open source package versions.

depsdev CLI client (and Golang module) for deps.dev API. Free access to dependencies, licenses, advisories, and other critical health and security sig

May 11, 2023
Tabular simplifies printing ASCII tables from command line utilities

tabular Tabular simplifies printing ASCII tables from command line utilities without the need to pass large sets of data to it's API. Simply define th

Oct 28, 2022
Small utility package for stealing tokens from other processes and using them in current threads, or duplicating them and starting other processes

getsystem small utility for impersonating a user in the current thread or starting a new process with a duplicated token. must already be in a high in

Dec 24, 2022
Sep 23, 2022
JSONL graph tools - Graph is represented as JSONL of nodes and edges.

JSONL graph tools - Graph is represented as JSONL of nodes and edges.

Sep 27, 2022
The DGL Operator makes it easy to run Deep Graph Library (DGL) graph neural network training on Kubernetes

DGL Operator The DGL Operator makes it easy to run Deep Graph Library (DGL) graph neural network distributed or non-distributed training on Kubernetes

Dec 19, 2022
dagger is a fast, concurrency safe, mutable, in-memory directed graph library with zero dependencies

dagger is a blazing fast, concurrency safe, mutable, in-memory directed graph implementation with zero dependencies

Dec 19, 2022
A simple, fast, and fun package for building command line apps in Go

cli cli is a simple, fast, and fun package for building command line apps in Go. The goal is to enable developers to write fast and distributable comm

Dec 31, 2022
cli is a simple, fast, and fun package for building command line apps in Go.

cli cli is a simple, fast, and fun package for building command line apps in Go. The goal is to enable developers to write fast and distributable comm

Jul 10, 2022
A command to output longified ascii art.

longify A command to output longified ascii art. Inspired by Tweet from @sheepla: https://twitter.com/Sheeeeepla/status/1522199846870196225 Installati

Sep 12, 2022
💨 A real time messaging system to build a scalable in-app notifications, multiplayer games, chat apps in web and mobile apps.

Beaver A Real Time Messaging Server. Beaver is a real-time messaging server. With beaver you can easily build scalable in-app notifications, realtime

Jan 1, 2023
OTF font with vertical bars for one-line ASCII spectrum analyzers, graphs, etc

graph-bars-font OTF font with vertical bars for one-line ASCII spectrum analyzers, graphs, etc. I didn't find anything similar on the net so I decided

Jul 28, 2022
Query, update and convert data structures from the command line. Comparable to jq/yq but supports JSON, TOML, YAML, XML and CSV with zero runtime dependencies.

dasel Dasel (short for data-selector) allows you to query and modify data structures using selector strings. Comparable to jq / yq, but supports JSON,

Jan 2, 2023