Intro to Observability: OpenTelemetry in Go
This application is here for you to try out tracing. It consists of a microservice that calls itself, so you can simulate a whole microservice ecosystem with just one service!
What to do
Shortest route: Remix this app on Glitch.
Run locally
If you use VSCode Devcontainers, this repository is set up for that.
Otherwise, we expect golang to be set up.
Configure tracing to Honeycomb
Create a .env file:
cp .env.example .env
In .env, populate these environment variables:
HONEYCOMB_API_KEY=replace-this-with-a-real-api-key
HONEYCOMB_DATASET=otel-go
SERVICE_NAME=fibonacci-microservice
Get a Honeycomb API Key from your Team Settings in Honeycomb. (find this by clicking on your profile in the lower-left corner.)
You can name the Honeycomb Dataset anything you want.
You can choose any Service Name you want.
Start the app
./init.sh
This runs src/main.go.
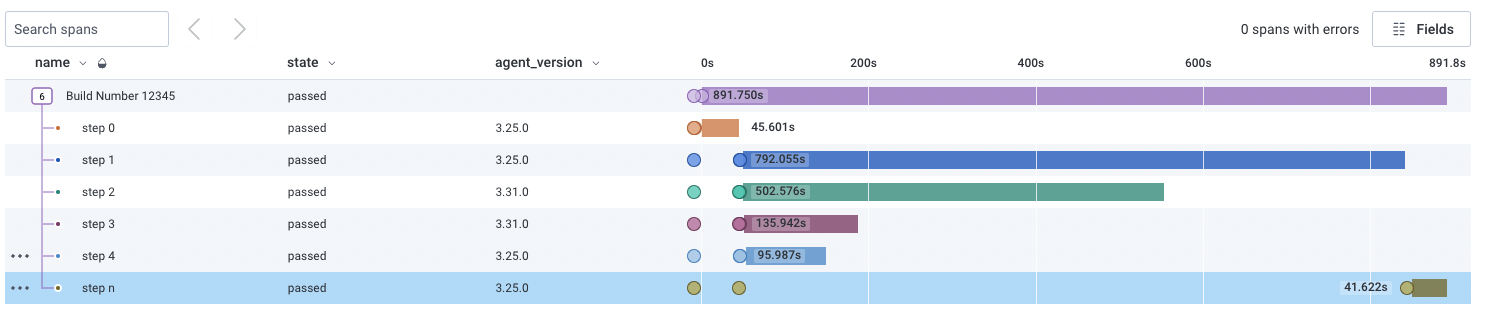
See the results
Run the app. Activate the sequence of numbers. Go to Honeycomb and choose the Dataset you configured.
How many traces are there?
How many spans are in the traces?
Why are there so many??
Which trace has the most, and why is it different?
2. Customize a span
Let's make it easier to see what the "index" query parameter is.
In the fibHandler function in main.go, after parsing the index from the query, add it as a custom attribute (search for "CUSTOM ATTRIBUTE" in main.go):
trace.SpanFromContext(ctx).SetAttributes(attribute.Int("parameter.index", i))
Restart the app, make the sequence go, and find that field on the new spans.
Can you make the trace waterfall view show the index? What pattern does it show?
3. Create a custom span
Make the calculation into its own span, to see how much of the time spent on this service is the meat: adding the fibonacci numbers.
In fibHandler, surround the addition statement with a span start and end (seach for "CUSTOM SPAN" to find it):
	tr := otel.Tracer("calculator")
	ctx, span := tr.Start(ctx, "calculation")
  // interesting code here
	defer span.End()
After a restart, do your traces show this extra span? Do you see the name of your method? What percentage of the service time is spend in it?


![[WIP] README Updates](https://avatars.githubusercontent.com/u/5807053?v=4)

