![]() 哪吒监控 一站式轻监控轻运维系统。支持系统状态、HTTP(SSL 证书变更、即将到期、到期)、TCP、Ping 监控报警,命令批量执行和计划任务。
哪吒监控 一站式轻监控轻运维系统。支持系统状态、HTTP(SSL 证书变更、即将到期、到期)、TCP、Ping 监控报警,命令批量执行和计划任务。
>> QQ 交流群:872069346 加群要求:已搭建好哪吒监控 & 有 2+ 服务器
>> 我们的用户 (Google)
| 默认主题 | DayNight @JackieSung | hotaru |
|---|---|---|
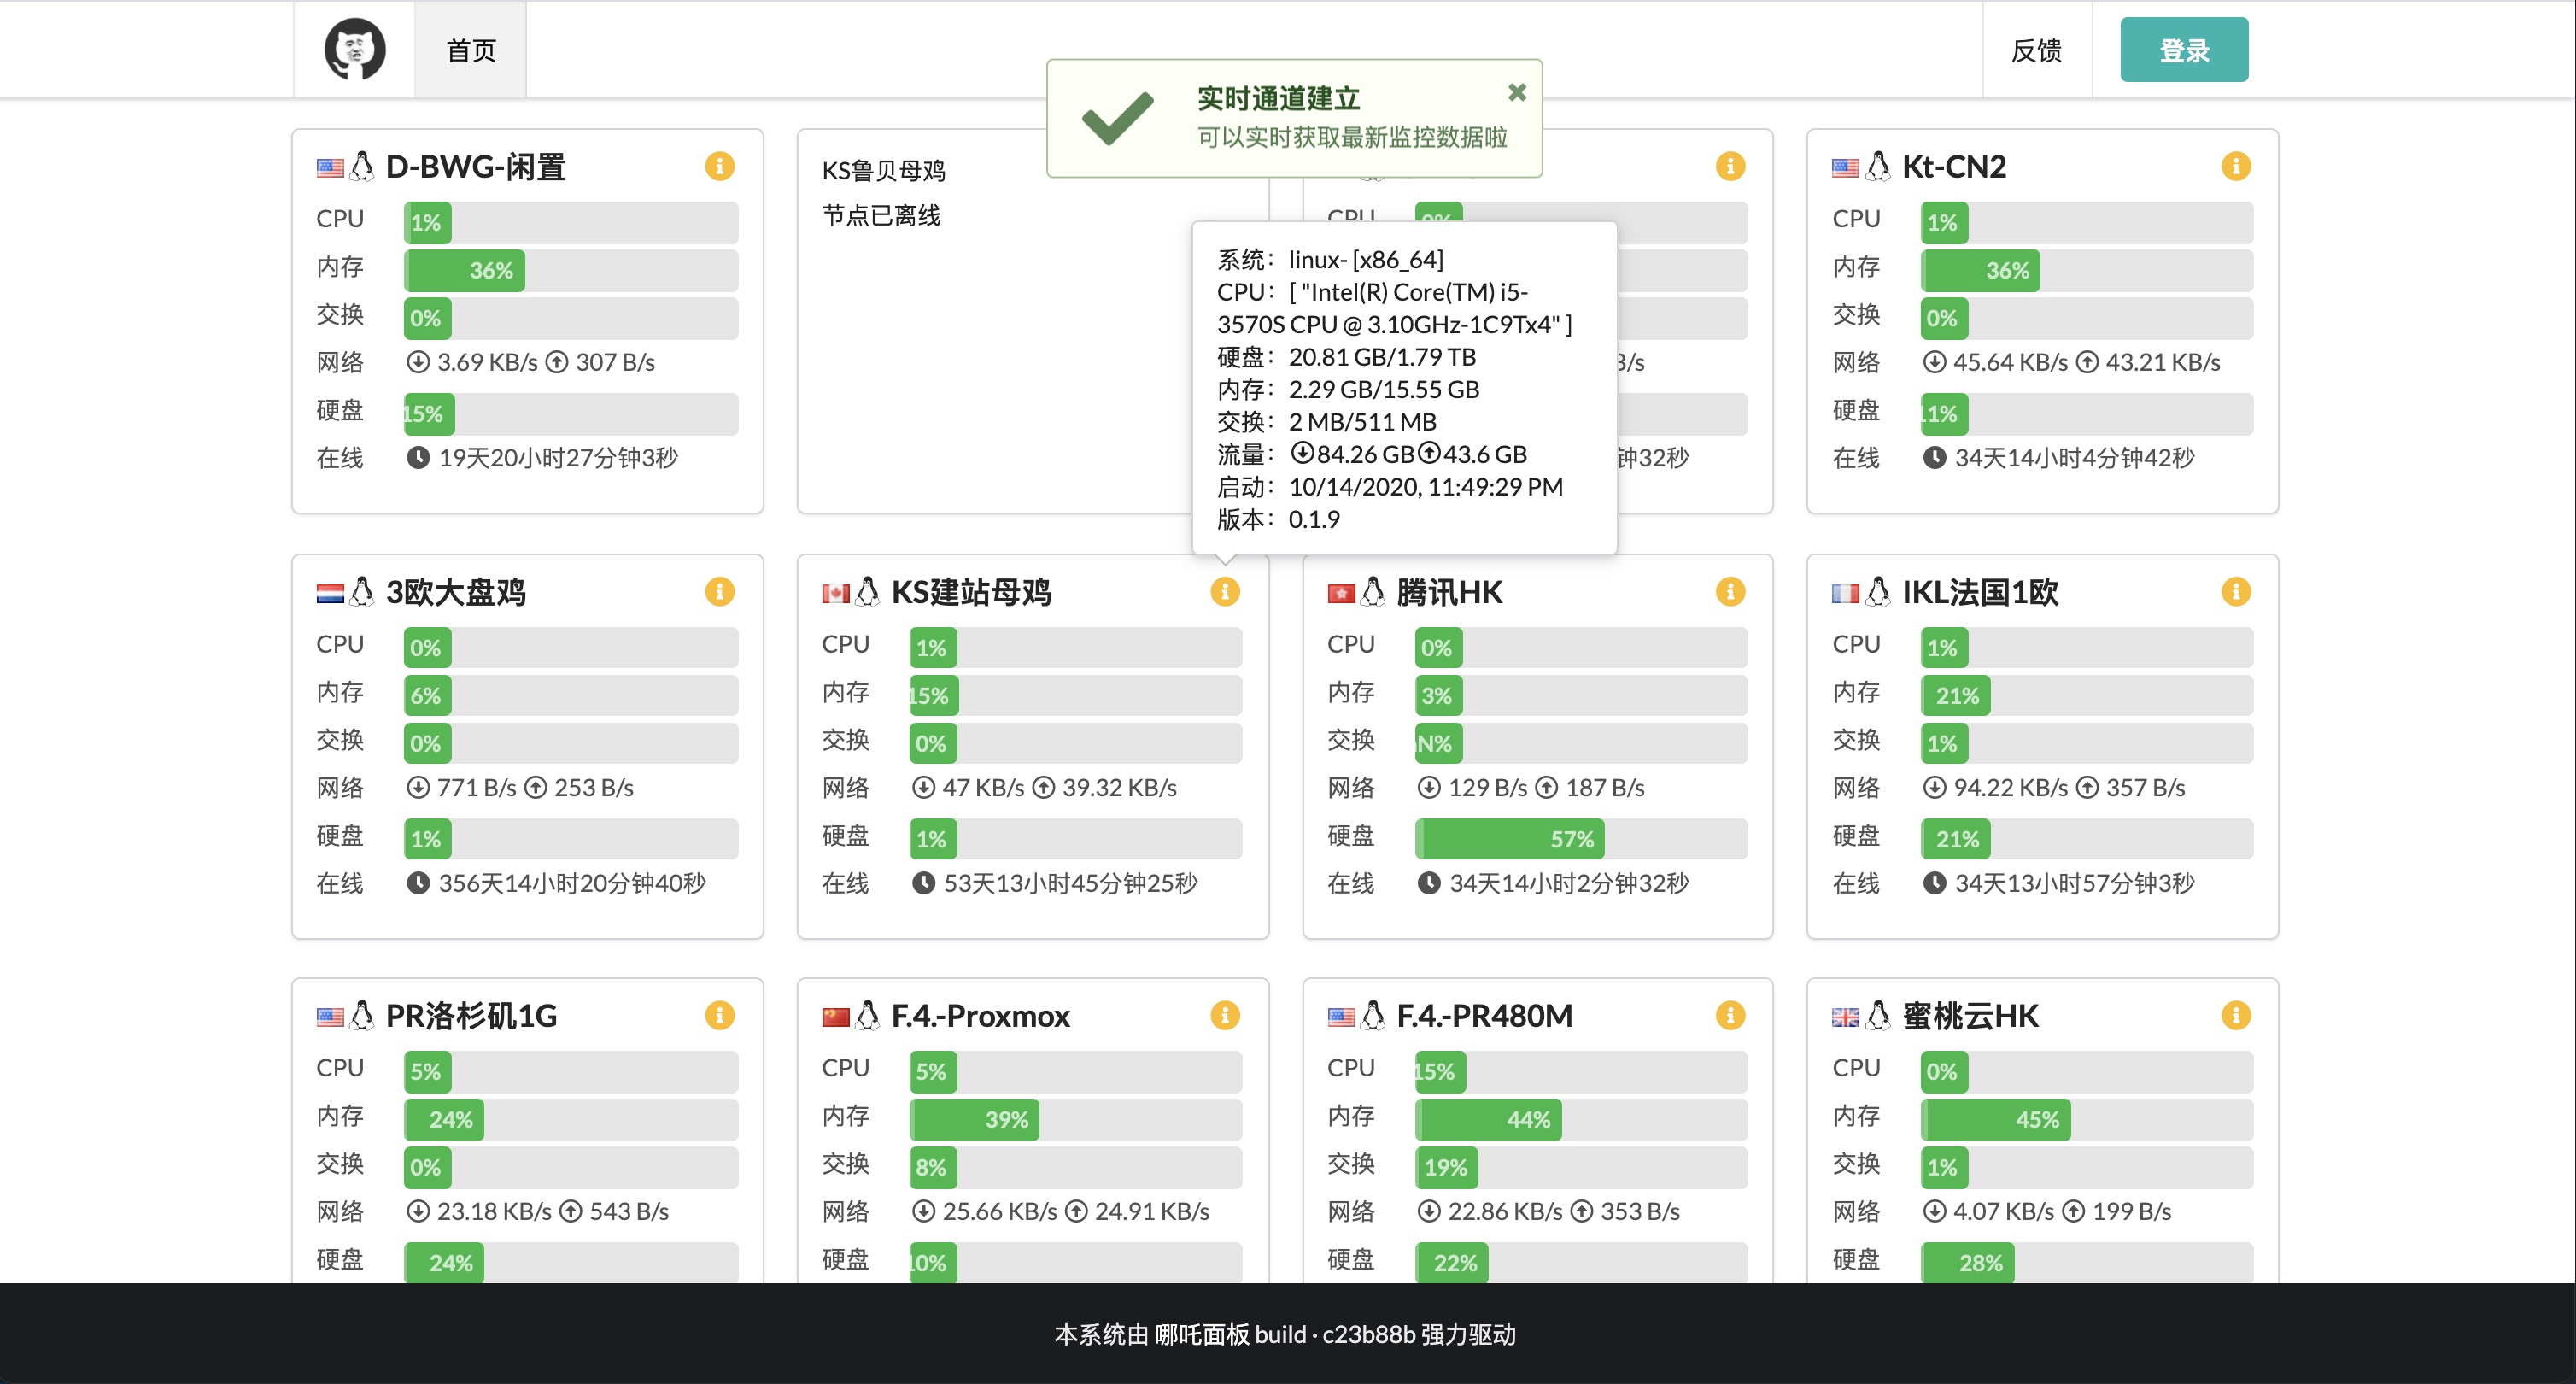 |
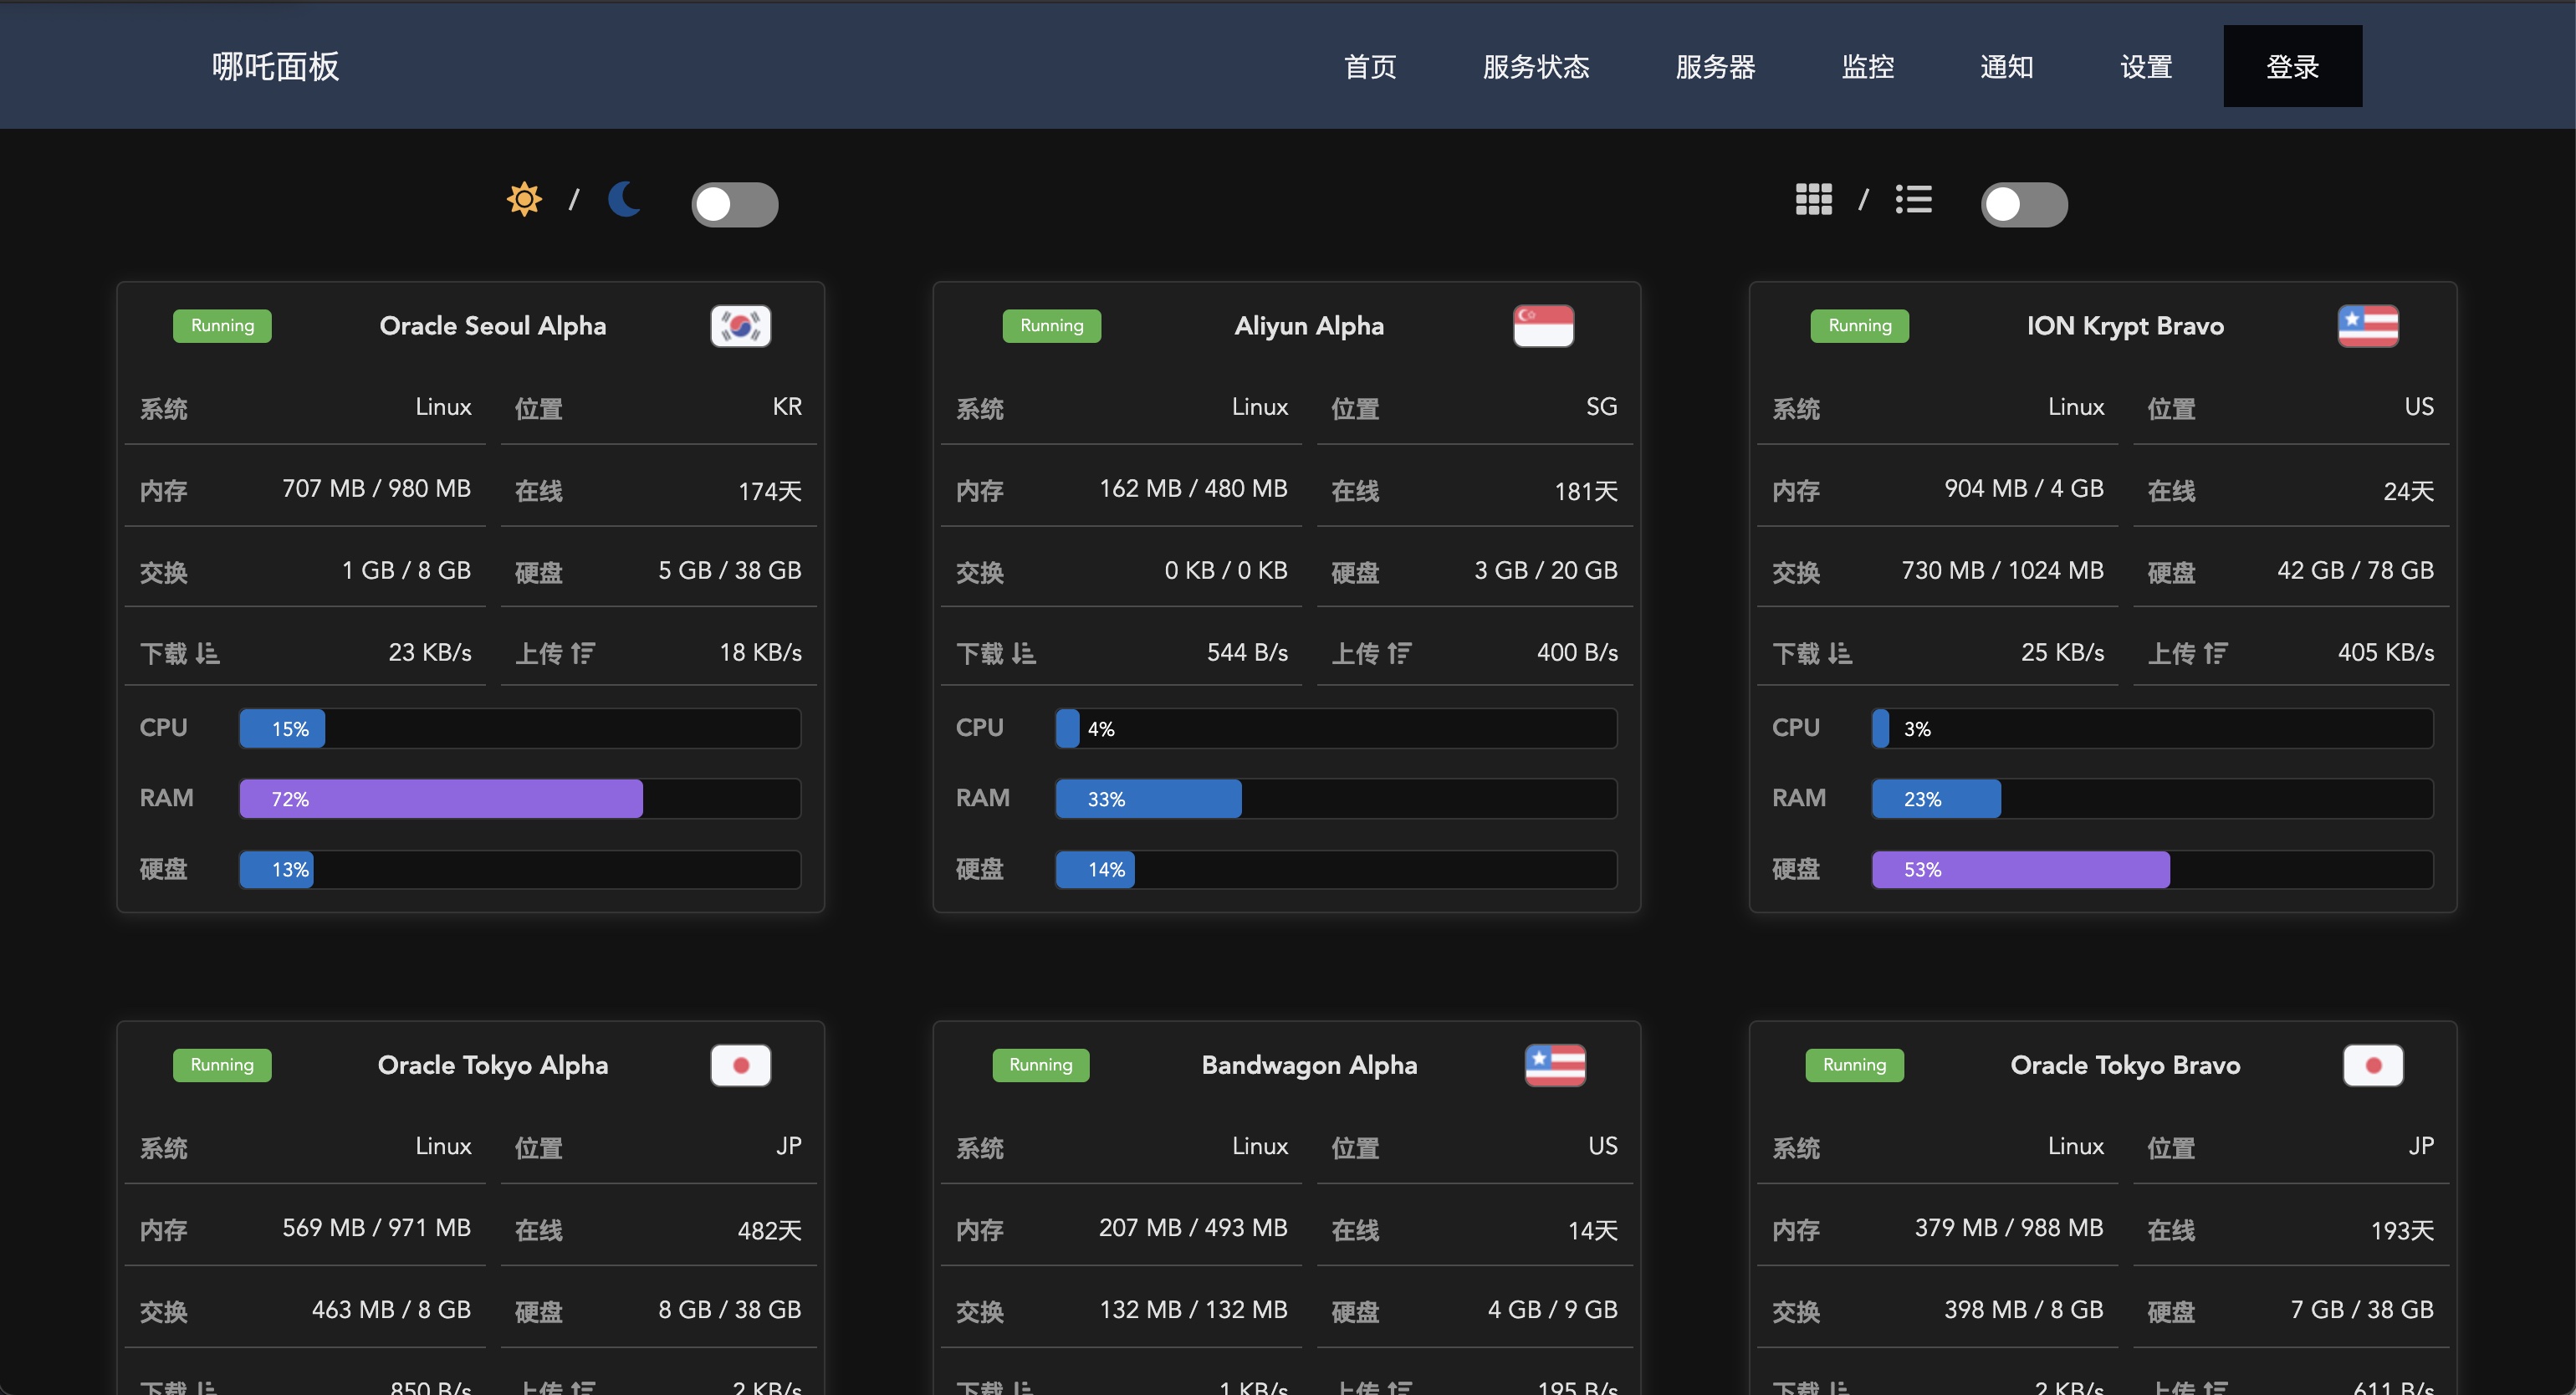 |
 |
安装脚本
推荐配置: 安装前准备 两个域名,一个可以 接入 CDN 作为 公开访问,比如 (status.nai.ba);另外一个解析到面板服务器作为 Agent 连接 Dashboard 使用,不能接入 CDN 直接暴露面板主机 IP,比如(randomdashboard.nai.ba)。
curl -L https://raw.githubusercontent.com/naiba/nezha/master/script/install.sh  -o nezha.sh && chmod +x nezha.sh
sudo ./nezha.sh
国内镜像加速:
curl -L https://cdn.jsdelivr.net/gh/naiba/nezha@master/script/install.sh -o nezha.sh && chmod +x nezha.sh
CN=true sudo ./nezha.sh
* 使用 WatchTower 可以自动更新面板,Windows 终端可以使用 nssm 配置自启动(见尾部教程)
功能说明
计划任务:备份脚本、服务重启,等定期运维任务。
使用此功能可以定期结合 restic、rclone 给服务器备份,或者定期某项重启服务来重置网络连接。
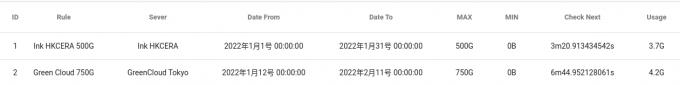
报警通知:CPU、内存、硬盘、带宽、流量实时监控。
灵活通知方式
#NEZHA# 是面板消息占位符,面板触发通知时会自动替换占位符到实际消息
Body 内容是JSON 格式的:当请求类型为 FORM 时,值为 key:value 的形式,value 里面可放置占位符,通知时会自动替换。当请求类型为 JSON 时 只会简进行字符串替换后直接提交到URL。
URL 里面也可放置占位符,请求时会进行简单的字符串替换。
参考下方的示例,非常灵活。
-
添加通知方式
-
server 酱示例
- 名称:server 酱
- URL:https://sc.ftqq.com/SCUrandomkeys.send?text=#NEZHA#
- 请求方式: GET
- 请求类型: 默认
- Body: 空
-
wxpusher 示例,需要关注你的应用
- 名称: wxpusher
- URL:http://wxpusher.zjiecode.com/api/send/message
- 请求方式: POST
- 请求类型: JSON
- Body:
{"appToken":"你的appToken","topicIds":[],"content":"#NEZHA#","contentType":"1","uids":["你的uid"]}
-
telegram 示例 @haitau 贡献
- 名称:telegram 机器人消息通知
- URL:https://api.telegram.org/botXXXXXX/sendMessage?chat_id=YYYYYY&text=#NEZHA#
- 请求方式: GET
- 请求类型: 默认
- Body: 空
- URL 参数获取说明:botXXXXXX 中的 XXXXXX 是在 telegram 中关注官方 @Botfather ,输入/newbot ,创建新的机器人(bot)时,会提供的 token(在提示 Use this token to access the HTTP API:后面一行)这里 'bot' 三个字母不可少。创建 bot 后,需要先在 telegram 中与 BOT 进行对话(随便发个消息),然后才可用 API 发送消息。YYYYYY 是 telegram 用户的数字 ID。与机器人@userinfobot 对话可获得。
-
-
添加一个离线报警
- 名称:离线通知
- 规则:
[{"Type":"offline","Duration":10}] - 启用:√
-
添加一个监控 CPU 持续 10s 超过 50% 且 内存持续 20s 占用低于 20% 的报警
- 名称:CPU+内存
- 规则:
[{"Type":"cpu","Min":0,"Max":50,"Duration":10},{"Type":"memory","Min":20,"Max":0,"Duration":20}] - 启用:√
报警规则说明
- Type
- cpu、memory、swap、disk:Min/Max 数值为占用百分比
- net_in_speed(入站网速)、net_out_speed(出站网速)、net_all_speed(双向网速)、transfer_in(入站流量)、transfer_out(出站流量)、transfer_all(双向流量):Min/Max 数值为字节(1kb=1024,1mb = 1024*1024)
- offline:不支持 Min/Max 参数
- Duration:持续秒数,监控比较简陋,取持续时间内的 70% 采样结果
- Cover
[{"Type":"offline","Duration":10, "Cover": 0, "Ignore":{"5": true}}]0监控所有,通过Ignore忽略特定服务器1忽略所有,通过Ignore监控特定服务器
- Ignore:
{"1": true, "2":false}特定服务器,搭配Cover使用
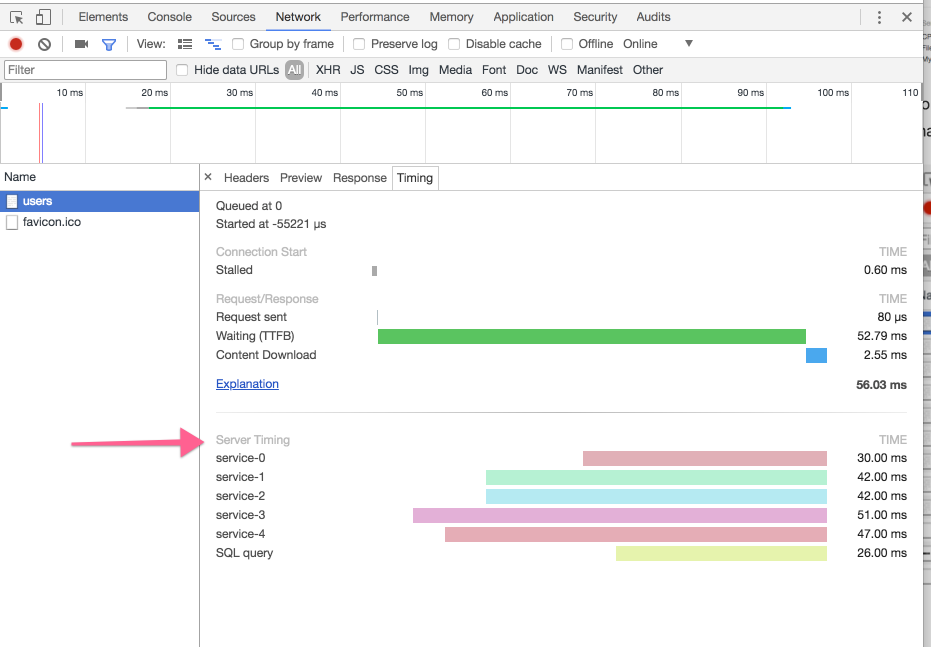
服务监控:HTTP、SSL证书、ping、TCP 端口等。
进入 /monitor 页面点击新建监控即可,表单下面有相关说明。
自定义代码:改LOGO、改色调、加统计代码等。
-
默认主题更改进度条颜色示例
-
DayNight 主题更改进度条颜色示例(来自 @hyt-allen-xu)
-
默认主题修改 LOGO、移除版权示例(来自 @iLay1678)
"> -
DayNight 移除版权示例(来自 @hyt-allen-xu)
"> -
hotaru 主题更改背景图片示例
常见问题
如何进行数据迁移、备份恢复?
数据储存在 /opt/nezha 文件夹中,迁移数据时打包这个文件夹,到新环境解压。然后执行一键脚本安装即可
如何使 OpenWrt/LEDE 自启动?来自 @艾斯德斯
首先在 release 下载对应的二进制解压 tar.gz 包后放置到 /root,然后 chmod +x /root/nezha-agent 赋予执行权限,然后创建 /etc/init.d/nezha-service:
#!/bin/sh /etc/rc.common

START=99
USE_PROCD=1

start_service() {
	procd_open_instance
	procd_set_param command /root/nezha-agent -s 面板网址:接收端口 -p 唯一秘钥 -d
	procd_set_param respawn
	procd_close_instance
}

stop_service() {
    killall nezha-agent
}

restart() {
	stop
	sleep 2
	start
}
赋予执行权限 chmod +x /etc/init.d/nezha-service 然后启动服务 /etc/init.d/nezha-service enable && /etc/init.d/nezha-service start
首页服务器随机闪烁掉线?
执行 ntpdate 0.pool.ntp.org 同步一下面板部署所在的服务器的时间,ref: How do I use pool.ntp.org?
提示实时通道断开?
启用 HTTPS
使用宝塔反代或者上 CDN,建议 Agent 配置 跟 访问管理面板 使用不同的域名,这样管理面板使用的域名可以直接套 CDN,Agent 配置的域名是解析管理面板 IP 使用的,也方便后面管理面板迁移(如果你使用 IP,后面 IP 更换了,需要修改每个 agent,就麻烦了)
实时通道断开(WebSocket 反代)
使用反向代理时需要针对 /ws 路径的 WebSocket 进行特别配置以支持实时更新服务器状态。
-
Nginx(宝塔):在你的 nginx 配置文件中加入以下代码
server{

    #原有的一些配置
    #server_name blablabla...

    location /ws {
        proxy_pass http://ip:站点访问端口;
        proxy_http_version 1.1;
        proxy_set_header Upgrade $http_upgrade;
        proxy_set_header Connection "Upgrade";
        proxy_set_header Host $host;
    }

    #其他的 location blablabla...
}
-
CaddyServer v1(v2 无需特别配置)
proxy /ws http://ip:8008 {
    websocket
}