gosivy - Another visualization tool for Go process metrics

gosivy

Release go.dev reference

Another visualization tool for Go process metrics.

Demo

Gosivy tracks Go process's metrics and plot their evolution over time right into your terminal, no matter where it's running on. It helps you understand how your application consumes the resources.

Installation

Binary releases are available through here.

MacOS

brew install nakabonne/gosivy/gosivy

RHEL/CentOS

rpm -ivh https://github.com/nakabonne/gosivy/releases/download/v0.2.0/gosivy_0.2.0_linux_$(dpkg --print-architecture).rpm

Debian/Ubuntu

wget https://github.com/nakabonne/gosivy/releases/download/v0.2.0/gosivy_0.2.0_linux_$(dpkg --print-architecture).deb
apt install ./gosivy_0.2.0_linux_$(dpkg --print-architecture).deb

Go

Required: >= 1.10

go get github.com/nakabonne/gosivy

Quickstart

Unsure if Gosivy is for you? Watch Gosivy by using the example application.

Run the example application:

git clone https://github.com/nakabonne/gosivy.git && cd gosivy
go run examples/local/main.go

Then simply perform gosivy with no arguments (it automatically finds the process where the agent runs on):

gosivy

Press q to quit.

Usage

First up, you start the agent in the process where you want to collect statistics. Then execute gosivy to scrape from the agent periodically. You can diagnose processes running not only locally (local mode), but also on another host (remote mode).

Local Mode

Import github.com/nakabonne/gosivy/agent into the target application to launch the agent. See the local example.

package main

import "github.com/nakabonne/gosivy/agent"

func main() {
	if err := agent.Listen(agent.Options{}); err != nil {
		panic(err)
	}
	defer agent.Close()
}

With -l flag can list the processes where the agent runs on:

$ gosivy -l
PID   Exec Path
15788 foo  /path/to/foo

Give the PID of the process to be diagnosed:

$ gosivy 15788

Be sure to start the gosivy process as the same user as the target application.

Remote Mode

Give the address the agent listens on:

package main

import "github.com/nakabonne/gosivy/agent"

func main() {
	err := agent.Listen(agent.Options{
		Addr: ":9090",
	})
	if err != nil {
		panic(err)
	}
	defer agent.Close()
}

Specify the target's agent address accessible by the host where gosivy will be executed:

$ gosivy host.xz:9090

Settings

Command-line options are:

Usage:
  gosivy [flags] 

Flags:
      --debug                      Run in debug mode.
  -l, --list-processes             Show processes where gosivy agent runs on.
      --scrape-interval duration   Interval to scrape from the agent. It must be >= 1s (default 1s)
  -v, --version                    Print the current version.

Gosivy requires the config directory for pid management. By default it will be created undernearth $HOME/.config (APPDATA on windows). For those who want to assign another directory, GOSIVY_CONFIG_DIR environment variable is available.

Features

  • Simple - Show only minimal metrics.
  • Pull-based monitoring - The agent is designed to just listen on, so the target process does nothing unless you issue a request.
  • Wherever it's running on - Any process can be diagnosed as long as you can access the TCP socket the agent opens.

Supported Architectures

The architectures the agent can perform on are:

  • Darwin i386/amd64
  • Linux i386/amd64/arm(raspberry pi)
  • FreeBSD i386/amd64/arm
  • Windows/amd64
  • OpenBSD amd64
  • Solaris amd64

Those partially supported:

  • CPU on DragonFly BSD
  • host on Linux RISC-V

Built With

Inspired By

Author

Ryo Nakao <[email protected]>

Similar Resources

Tool to visualize the graph of embedded structs in Go projects

Tool to visualize the graph of embedded structs in Go projects

Visualize a hierarchy of embedded Go structs This tool scans a directory of Go source code files to create a visualization of struct embedding in the

Nov 27, 2022

An SVG-based tool to visualize public transport journeys retrieved from a HAFAS system

An SVG-based tool to visualize public transport journeys retrieved from a HAFAS system

Time-Space Train Planner An SVG-based tool to visualize public transport journeys retrieved from a HAFAS system, in order to see all possible connecti

Dec 17, 2022

Helm : a tool for managing Charts

Helm is a tool for managing Charts. Charts are packages of pre-configured Kubernetes resources.

Aug 25, 2022

gosivy - Real-time visualization tool for Go process metrics

 gosivy - Real-time visualization tool for Go process metrics

Gosivy tracks Go process's metrics and plot their evolution over time right into your terminal, no matter where it's running on. It helps you understand how your application consumes the resources.

Nov 27, 2022

Sensu-go-postgres-metrics - The sensu-go-postgres-metrics is a sensu check that collects PostgreSQL metrics

sensu-go-postgres-metrics Table of Contents Overview Known issues Usage examples

Jan 12, 2022

The metrics-agent collects allocation metrics from a Kubernetes cluster system and sends the metrics to cloudability

metrics-agent The metrics-agent collects allocation metrics from a Kubernetes cluster system and sends the metrics to cloudability to help you gain vi

Jan 14, 2022

The open and composable observability and data visualization platform. Visualize metrics, logs, and traces from multiple sources like Prometheus, Loki, Elasticsearch, InfluxDB, Postgres and many more.

The open and composable observability and data visualization platform. Visualize metrics, logs, and traces from multiple sources like Prometheus, Loki, Elasticsearch, InfluxDB, Postgres and many more.

The open-source platform for monitoring and observability. Grafana allows you to query, visualize, alert on and understand your metrics no matter wher

Jan 3, 2023

Gowl is a process management and process monitoring tool at once. An infinite worker pool gives you the ability to control the pool and processes and monitor their status.

Gowl is a process management and process monitoring tool at once. An infinite worker pool gives you the ability to control the pool and processes and monitor their status.

Gowl is a process management and process monitoring tool at once. An infinite worker pool gives you the ability to control the pool and processes and monitor their status.

Nov 10, 2022

Search running process for a given dll/function. Exposes a bufio.Scanner-like interface for walking a process' PEB

Search running process for a given dll/function. Exposes a bufio.Scanner-like interface for walking a process' PEB

Apr 21, 2022

A flexible process data collection, metrics, monitoring, instrumentation, and tracing client library for Go

A flexible process data collection, metrics, monitoring, instrumentation, and tracing client library for Go

Package monkit is a flexible code instrumenting and data collection library. See documentation at https://godoc.org/gopkg.in/spacemonkeygo/monkit.v3 S

Dec 14, 2022

Prometheus metrics for Go database/sql via VictoriaMetrics/metrics

sqlmetrics Prometheus metrics for Go database/sql via VictoriaMetrics/metrics Features Simple API. Easy to integrate. Install Go version 1.16+ go get

Dec 16, 2022

Go http.RoundTripper that emits open telemetry metrics. This helps you easily get metrics for all external APIs you interact with.

go-otelroundtripper This package provides an easy way to collect http related metrics (e.g Response times, Status Codes, number of in flight requests

Jan 8, 2023

cluster-api-state-metrics (CASM) is a service that listens to the Kubernetes API server and generates metrics about the state of custom resource objects related of Kubernetes Cluster API.

Overview cluster-api-state-metrics (CASM) is a service that listens to the Kubernetes API server and generates metrics about the state of custom resou

Oct 27, 2022

AutoK3s GEO collects metrics about locates remote IP-address and exposes metrics to InfluxDB.

AutoK3s GEO AutoK3s GEO collects metrics about locates remote IP-address and exposes metrics to InfluxDB. Thanks to https://freegeoip.live/ which prov

Jun 16, 2022

Flash-metrics - Flash Metrics Storage With Golang

Flash Metrics Storage bootstrap: $ echo -e "max-index-length = 12288" tidb.con

Jan 8, 2022

This library provides a metrics package which can be used to instrument code, expose application metrics, and profile runtime performance in a flexible manner.

This library provides a metrics package which can be used to instrument code, expose application metrics, and profile runtime performance in a flexible manner.

Jan 18, 2022

A Go dependency graph visualization tool

A Go dependency graph visualization tool

godepgraph godepgraph is a program for generating a dependency graph of Go packages. Install go get github.com/kisielk/godepgraph Use For basic usage

Jan 7, 2023

Tool for shell commands execution, visualization and alerting. Configured with a simple YAML file.

Tool for shell commands execution, visualization and alerting. Configured with a simple YAML file.

Sampler. Visualization for any shell command. Sampler is a tool for shell commands execution, visualization and alerting. Configured with a simple YAM

Dec 28, 2022

pprof is a tool for visualization and analysis of profiling data

Introduction pprof is a tool for visualization and analysis of profiling data. pprof reads a collection of profiling samples in profile.proto format a

Jan 8, 2023
Comments
  • Change catchphrase to avoid confusing

    Change catchphrase to avoid confusing

    "Yet another" implies that the list of things being counted is getting really long, and suggests a certain amount of impatience or irritation on the part of the speaker.

  • Reuse connections instead of creating each time

    Reuse connections instead of creating each time

    We'd better re-use one TCPConn again and again. https://github.com/nakabonne/gosivy/blob/97c565dc08809171a215b299aac397842dbe1519/diagnoser/diagnoser.go#L61-L64

  • Windows support

    Windows support

    For some reasons, cannot build for windows_amd64. gopsutil/process should support it but something wrong.

    release failed after 49.59s error=failed to build for windows_amd64: # github.com/shirou/gopsutil/process
    Error: ../../../go/pkg/mod/github.com/shirou/[email protected]+incompatible/process/process_windows.go:184:13: undefined: "golang.org/x/sys/windows".EnumProcesses
    
  • Use time as a data point of X-axis

    Use time as a data point of X-axis

    Currently it just counts up the numbers as data points of the X-axis, but it would be nice to be able to display the time.

    Refer to: https://github.com/slok/grafterm

Callgraph analysis and visualization for Go

Gocyto A Go SSA callgraph builder and visualizer, by @protolambda. Features: output to generic Cytoscape JSON format. (list of nodes, list of edges) o

Nov 3, 2022
🚀Statsview is a real-time Golang runtime stats visualization profiler

Statsview is a real-time Golang runtime stats visualization profiler. It is built top on another open-source project, go-echarts, which helps statsview to show its graphs on the browser.

Dec 29, 2022
Interactive Terraform visualization. State and configuration explorer.

Rover - Terraform Visualizer Rover is a Terraform visualizer. In order to do this, Rover: generates a plan file and parses the configuration in the ro

Jan 9, 2023
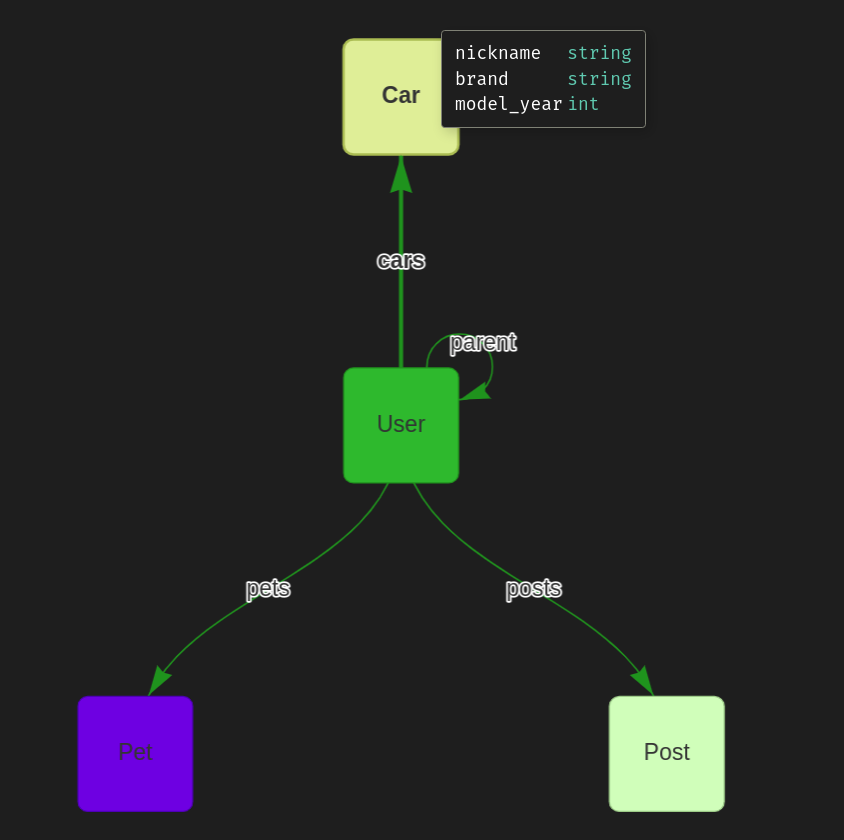
entviz is an ent extension that provides visualization of the schema graph

entviz entviz is an ent extension that creates visual graph (html file) of your ent's schema. install go get github.com/hedwigz/entviz add this exten

Dec 9, 2022
Sloop - Kubernetes History Visualization
 Sloop - Kubernetes History Visualization

Sloop - Kubernetes History Visualization Sloop monitors Kubernetes, recording histories of events and resource state changes and providing visualizati

Dec 27, 2022
Data visualization with chart, Create CSV file, Read Write CSV file

Data visualization with chart, Create CSV file, Read Write CSV file, Read from json file and many more in single project ......

Jan 13, 2022
Exports Speedtest CLI metrics in the prometheus format, caching the results.

Exports Speedtest CLI metrics in the prometheus format, caching the results.

Oct 21, 2022
Exports Fast.com metrics in the prometheus format, caching the results.

fastcom-exporter Exports Fast.com metrics in the prometheus format, caching the results.

Nov 14, 2022
A golang implementation of endlessh exporting Prometheus metrics, visualized by a Grafana dashboard.

endlessh-go A golang implementation of endlessh exporting Prometheus metrics, visualized by a Grafana dashboard. Introduction Endlessh is a great idea

Dec 23, 2022
Tool that can parse Go files into an abstract syntax tree and translate it to several programming languages.

GoDMT GoDMT, the one and only Go Data Model Translator. The goal of this project is to provide a tool that can parse Go files that include var, const,

Nov 28, 2022