Gitana is a lightweight dashboard sync

Overview

Gitana is a lightweight application that will help you sync Grafana dashboards from a Git repository to Kubernetes ConfigMap and leverages the dashboard sidecar on the Grafana helm chart that provisions dashboard ConfigMaps created by Gitana into Grafana.

Sync Command Flags

./gitana sync --help

The sync command pulls the Grafana dashboards from a Git repository and foreach dashboard it will creates a config map for that dashboard:

Usage:
  gitana sync [flags]

Flags:
      --dashboard.folder-annotation string   dashboard folder annotation
      --dashboard.labels string              dashboard label selector (default "grafana_dashboard=nil")
  -h, --help                                 help for sync
      --http.port string                     listem port for http endpoints (default ":9754")
      --kubeconfig string                    (optional) absolute path to the kubeconfig file
      --log.level string                     log level (default "info")
      --namespace string                     namespace that will store the dashboard config map (default "default")
      --repository.auth.password string      password to perform authentication
      --repository.auth.username string      username to perform authentication
      --repository.branch string             git repository branch (default "main")
      --repository.url string                git repository url
      --sync-timer duration                  interval to sync and sync dashboards (default 5m)

Contributing

Contributions are very welcome! See our CONTRIBUTING.md for more information.

Docker images

Docker images are available on Docker Hub.

Building from source

To build Gitana from source code, first ensure that you have a working Go environment with version 1.16 or greater installed.

To build the source code you can use the make build, which will compile in the assets so that Gitana can be run from anywhere:

    $ mkdir -p $GOPATH/src/github.com/gitana
    $ cd $GOPATH/src/github.com/gitana
    $ git clone https://github.com/nicolastakashi/gitana.git
    $ cd gitana
    $ make build
    $ ./gitana sync <args>

The Makefile provides several targets:

  • build: build the gitana
  • fmt: format the source code
  • vet: check the source code for common errors
Owner
Nicolas Takashi
Born in 🇧🇷 living in 🇵🇹, I love to speak and write about distributed systems, cloud computing, architecture, systems engineering, and APIs.
Nicolas Takashi
Comments
  • Add flag to provide dashboard path inside git repositoru

    Add flag to provide dashboard path inside git repositoru

    Is your feature request related to a problem? Please describe. When I'm trying to create dashboards from git repositories with many other files and folders, I want to be able to specify where the dashboards are placed.

    Describe the solution you'd like I want to be able to provide a flag such as: repository.dashboard-path, so that I can ensure that only dashboards will be scanned.

    Describe alternatives you've considered N/A

    Additional context N/A

  • Create a gitana helm chart.

    Create a gitana helm chart.

    Is your feature request related to a problem? Please describe. N/A

    Describe the solution you'd like It could be awesome if the gitana provides a helm chart to help the teams deploy it on Kubernetes.

    Describe alternatives you've considered N/A

    Additional context N/A

  • [FIX] Fixed repository exists error

    [FIX] Fixed repository exists error

    Description: Updated the git client to fix the "repo already exists, trying pull" error.

    The previous version showed this error when running the tests: image

    The new version corrected this and passes all the tests: image

  • Add automated tests

    Add automated tests

    Is your feature request related to a problem? Please describe. Currently, gitana does not have any automated tests.

    Describe the solution you'd like Add a set of automated tests to ensure the proper functionality.

    Describe alternatives you've considered N/A

    Additional context N/A

  • Provide config by config file as an alternative to command flags

    Provide config by config file as an alternative to command flags

    Is your feature request related to a problem? Please describe. N/A

    Describe the solution you'd like It could be nice if gitana allowed configuration from a config file as an alternative to command flags.

    Describe alternatives you've considered Add a flag to gitana that allows a config file path to use in place of command flags.

    Additional context N/A

Terraform-grafana-dashboard - Grafana dashboard Terraform module

terraform-grafana-dashboard terraform-grafana-dashboard for project Requirements

May 2, 2022
Github-workflow-dashboard - WEB and CLI dashboard for github action workflows

CLI capable of retrieving github action workflows stats Example usage Dashboard

Aug 30, 2022
grafana-sync Keep your grafana dashboards in sync.

grafana-sync Keep your grafana dashboards in sync. Table of Contents grafana-sync Table of Contents Installing Getting Started Pull Save all dashboard

Dec 14, 2022
Terminal based dashboard.

Termdash is a cross-platform customizable terminal based dashboard. The feature set is inspired by the gizak/termui project, which in turn was inspire

Dec 28, 2022
Golang terminal dashboard

termui termui is a cross-platform and fully-customizable terminal dashboard and widget library built on top of termbox-go. It is inspired by blessed-c

Dec 27, 2022
⛑ Gatus - Automated service health dashboard

A service health dashboard in Go that is meant to be used as a docker image with a custom configuration file. I personally deploy it in my Kubernetes

Dec 31, 2022
Open Source HTTP Reverse Proxy Cache and Time Series Dashboard Accelerator

Trickster is an HTTP reverse proxy/cache for http applications and a dashboard query accelerator for time series databases. Learn more below, and chec

Jan 2, 2023
Multi cluster kubernetes dashboard with batteries included. Build by developers, for developers.

kubetower Multi cluster kubernetes dashboard with batteries included. Built by developers, for developers. Features Restart deployments with one click

Nov 28, 2022
A Postgres Metrics Dashboard

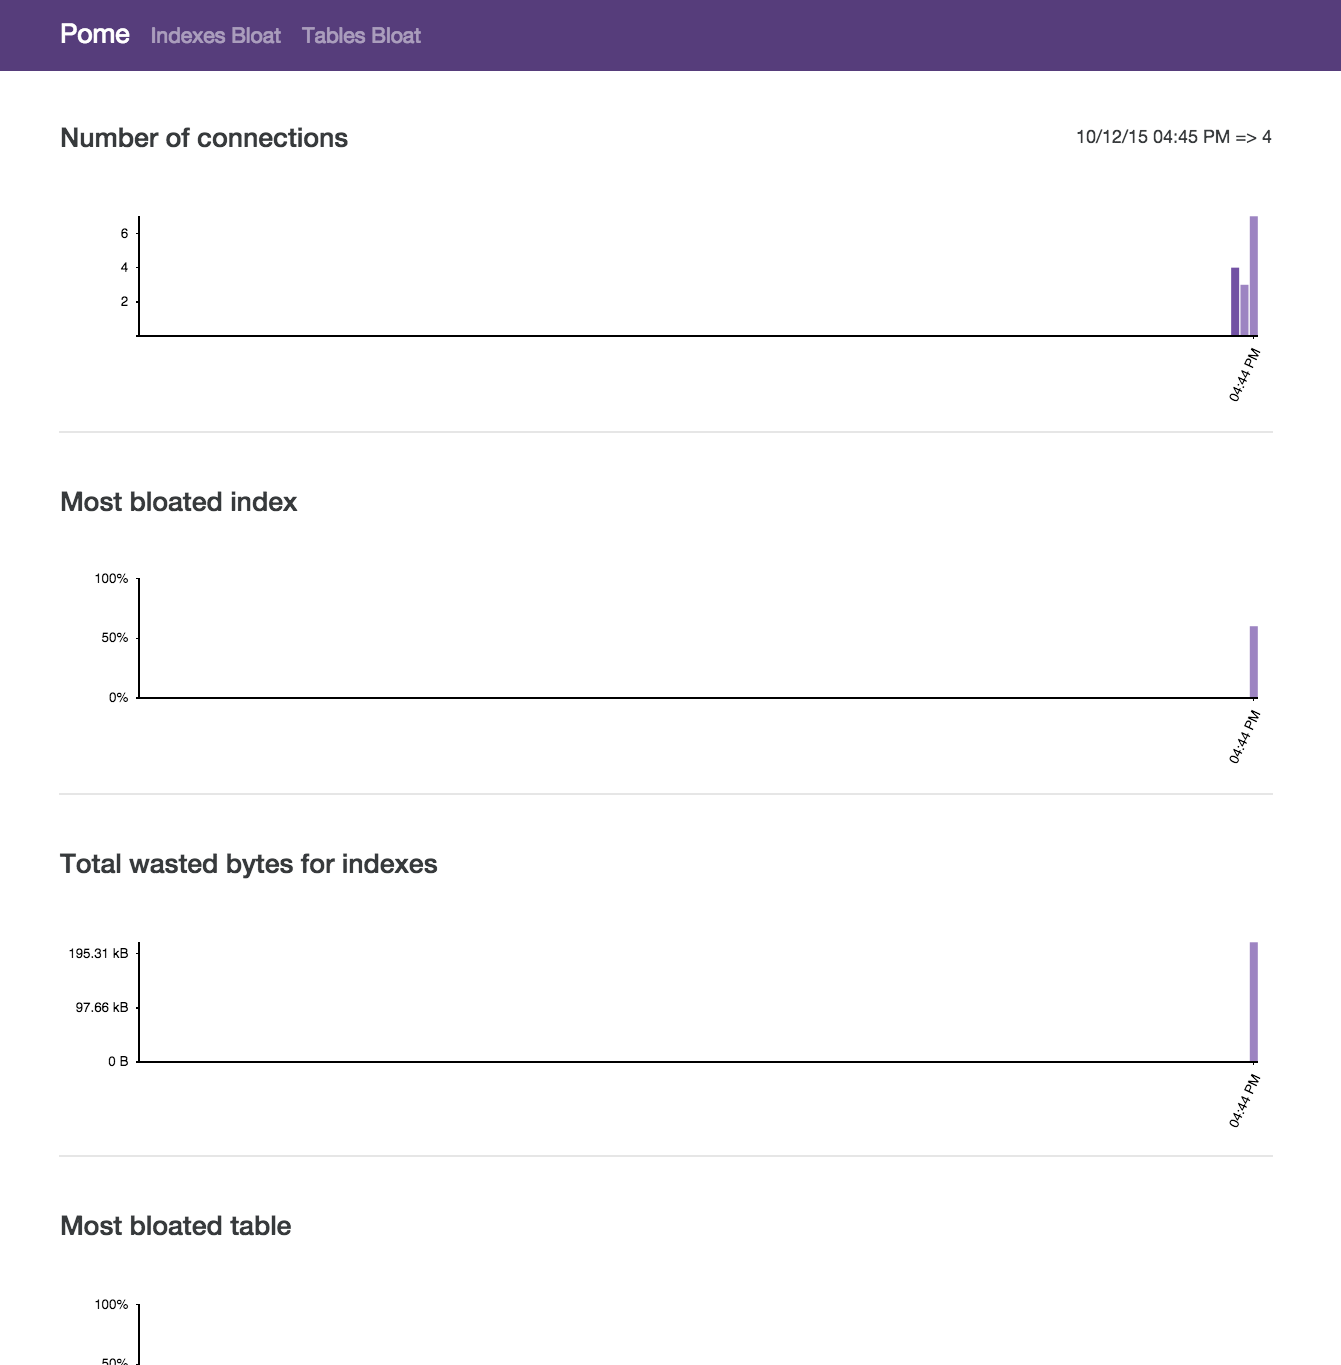
#Pome Pome stands for Postgres Metrics. Pome is a PostgreSQL Metrics Dashboard to keep track of the health of your database. This project is at a very

Dec 22, 2022
:bento: Highly Configurable Terminal Dashboard for Developers and Creators

DevDash is a highly configurable terminal dashboard for developers and creators who want to choose and display the most up-to-date metrics they need,

Jan 3, 2023
Tiny service health dashboard written in Go

GreenWall Status: Done (waiting for feedback) Description GreenWall is a tiny service health dashboard written in Go (with frontend prepared in Bootst

Nov 29, 2022
High performance, self-hosted newsletter and mailing list manager with a modern dashboard. Single binary app.

listmonk is a standalone, self-hosted, newsletter and mailing list manager. It is fast, feature-rich, and packed into a single binary. It uses a Postg

Dec 30, 2022
Golang terminal dashboard

termui termui is a cross-platform and fully-customizable terminal dashboard and widget library built on top of termbox-go. It is inspired by blessed-c

Dec 29, 2022
The personal information dashboard for your terminal

WTF (aka 'wtfutil') is the personal information dashboard for your terminal, providing at-a-glance access to your very important but infrequently-need

Dec 31, 2022
Terminal based dashboard.

Termdash is a cross-platform customizable terminal based dashboard. The feature set is inspired by the gizak/termui project, which in turn was inspire

Jan 1, 2023
🌍 📋 A web dashboard to inspect Terraform States
 🌍 📋 A web dashboard to inspect Terraform States

?? ?? A web dashboard to inspect Terraform States

Jan 1, 2023
Grafana Dashboard Manager

Grafana dash-n-grab Grafana Dash-n-Grab (GDG) -- Dashboard/DataSource Manager. The purpose of this project is to provide an easy to use CLI to interac

Dec 31, 2022
listmonk is a standalone high performance, self-hosted newsletter and mailing list manager with a modern dashboard. Single binary app.

listmonk is a standalone, self-hosted, newsletter and mailing list manager. It is fast, feature-rich, and packed into a single binary. It uses a PostgreSQL database as its data store.

Jan 1, 2023
Hajimari is a beautiful & customizable browser startpage/dashboard with Kubernetes application discovery.

Hajimari ?? ...The beginning of a pleasant experience Features Web search bar Dynamically list apps discovered from Kubernetes ingresses Support for n

Jan 4, 2023
Alert dashboard for Prometheus Alertmanager

karma Alert dashboard for Prometheus Alertmanager. Alertmanager >=0.19.0 is required as older versions might not show all receivers in karma, see issu

Dec 30, 2022