Open source Observability Platform. 👉 SigNoz helps developers find issues in their deployed applications & solve them quickly

SigNoz Logo

MIT

SigNoz

SigNoz is an opensource observability platform. SigNoz uses distributed tracing to gain visibility into your systems and powers data using Kafka (to handle high ingestion rate and backpressure) and Apache Druid (Apache Druid is a high performance real-time analytics database), both proven in the industry to handle scale.

SigNoz Feature

Features:

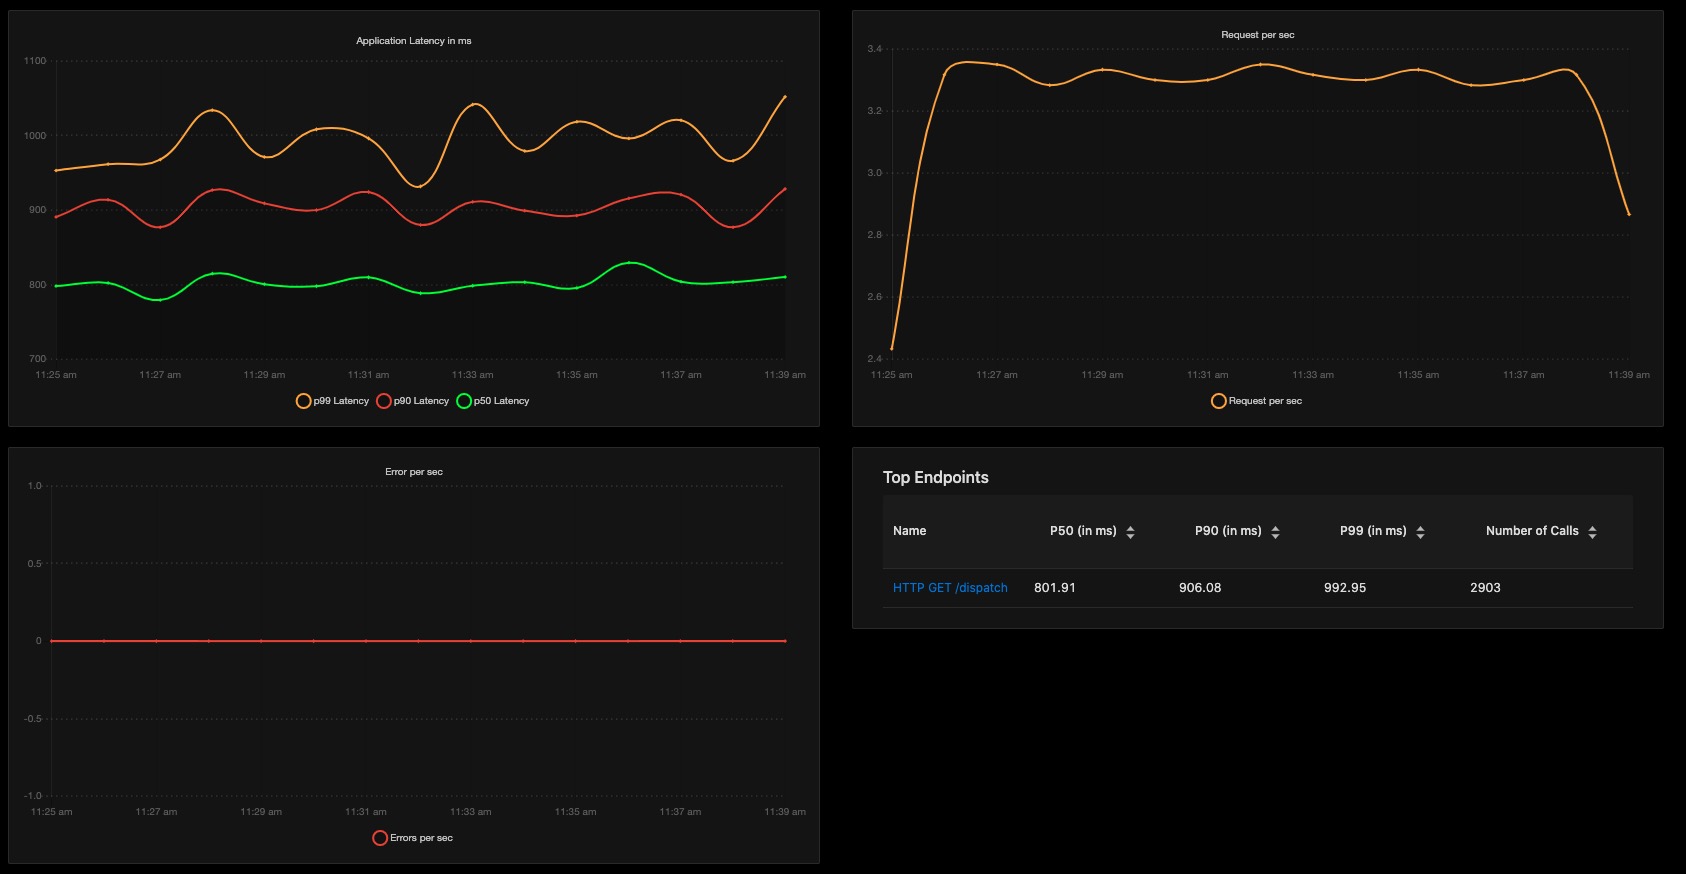
  • Application overview metrics like RPS, 50th/90th/99th Percentile latencies, and Error Rate
  • Slowest endpoints in your application
  • See exact request trace to figure out issues in downstream services, slow DB queries, call to 3rd party services like payment gateways, etc
  • Filter traces by service name, operation, latency, error, tags/annotations.
  • Aggregate metrics on filtered traces. Eg, you can get error rate and 99th percentile latency of customer_type: gold or deployment_version: v2 or external_call: paypal
  • Unified UI for metrics and traces. No need to switch from Prometheus to Jaeger to debug issues.
  • In-built workflows to reduce your efforts in detecting common issues like new deployment failures, 3rd party slow APIs, etc (Coming Soon)
  • Anomaly Detection Framework (Coming Soon)

Motivation:

  • SaaS vendors charge an insane amount to provide Application Monitoring. They often surprise you with huge month end bills without any transparency of data sent to them.
  • Data privacy and compliance demands data to not leave the network boundary
  • Highly scalable architecture
  • No more magic happening in agents installed in your infra. You take control of sampling, uptime, configuration.
  • Build modules over SigNoz to extend business specific capabilities

Getting Started

Deploy using docker-compose

We have a tiny-cluster setup and a standard setup to deploy using docker-compose. Follow the steps listed at https://signoz.io/docs/deployment/docker/. The troubleshooting instructions at https://signoz.io/docs/deployment/docker/#troubleshooting may be helpful

Deploy in Kubernetes using Helm.

Below steps will install the SigNoz in platform namespace inside your k8s cluster.

git clone https://github.com/SigNoz/signoz.git && cd signoz
helm dependency update deploy/kubernetes/platform
kubectl create ns platform
helm -n platform install signoz deploy/kubernetes/platform
kubectl -n platform apply -Rf deploy/kubernetes/jobs
kubectl -n platform apply -f deploy/kubernetes/otel-collector

*You can choose a different namespace too. In that case, you need to point your applications to correct address to send traces. In our sample application just change the JAEGER_ENDPOINT environment variable in sample-apps/hotrod/deployment.yaml

Test HotROD application with SigNoz

kubectl create ns sample-application
kubectl -n sample-application apply -Rf sample-apps/hotrod/

How to generate load

kubectl -n sample-application run strzal --image=djbingham/curl --restart='OnFailure' -i --tty --rm --command -- curl -X POST -F 'locust_count=6' -F 'hatch_rate=2' http://locust-master:8089/swarm

See UI

kubectl -n platform port-forward svc/signoz-frontend 3000:3000

How to stop load

kubectl -n sample-application run strzal --image=djbingham/curl --restart='OnFailure' -i --tty --rm --command -- curl http://locust-master:8089/stop

Documentation

You can find docs at https://signoz.io/docs/deployment/docker. If you need any clarification or find something missing, feel free to raise a GitHub issue with the label documentation or reach out to us at the community slack channel.

Community

Join the slack community to know more about distributed tracing, observability, or SigNoz and to connect with other users and contributors.

If you have any ideas, questions, or any feedback, please share on our Github Discussions

Owner
SigNoz
Open source Observability Platform
SigNoz
Comments
  • otel-collector panic: runtime error: invalid memory address or nil pointer dereference

    otel-collector panic: runtime error: invalid memory address or nil pointer dereference

    Bug description

    Hello opentelemetry-collector can't run because of error

    Expected behavior

    2022-07-27T11:46:33.354Z	info	service/collector.go:124	Everything is ready. Begin running and processing data.
    panic: runtime error: invalid memory address or nil pointer dereference
    [signal SIGSEGV: segmentation violation code=0x1 addr=0x28 pc=0x1063552]
    
    goroutine 137 [running]:
    github.com/open-telemetry/opentelemetry-collector-contrib/exporter/clickhousemetricsexporter.(*PrwExporter).export.func1()
    	/src/exporter/clickhousemetricsexporter/exporter.go:279 +0xf2
    created by github.com/open-telemetry/opentelemetry-collector-contrib/exporter/clickhousemetricsexporter.(*PrwExporter).export
    	/src/exporter/clickhousemetricsexporter/exporter.go:275 +0x256
    

    How to reproduce

    1. values.yaml
    2. helm upgrade -i signoz signoz/signoz -f values.yaml

    Version information

    • frontend version: '0.10.0'
    • query-service version: '0.10.0'
    • alertmanager version: '0.23.0-0.1'
    • otel-collector version: '0.45.1-1.0'
    • otel-collector-metrics version: '0.45.1-1.0'
    • Chart version: 0.2.0
    • Chart appVersion: 0.10.0

    Additional context

    Thank you for your bug report – we love squashing them!

  • refactor(ports): 💥 avoid exposing unnecessary ports and update frontend port to 3301

    refactor(ports): 💥 avoid exposing unnecessary ports and update frontend port to 3301

    There were users who reported running into issues because they had other applications running on the exact port(s). If any of the ports are required by users, please feel free to expose them on your set up.

    Update: Frontend port changed from 3000 to 3301

    BREAKING CHANGE:

    Signed-off-by: Prashant Shahi [email protected]

  • Time selected changes from 5min to 30min/1hr or vice versa on clicking refresh button

    Time selected changes from 5min to 30min/1hr or vice versa on clicking refresh button

    Bug description

    Time selected changes from 5min to 30min/1hr on clicking refresh

    Expected behavior

    Time selected shouldn't jump from 5min to 30min/1hr on clicking refresh button

    How to reproduce

    1. Open SigNoz UI for the first time - confirm that the time selected is 5min in the /application page
    2. Click any service and go to metrics page, confirm time selected is 5min
    3. Press refresh button beside time selector, the time changes from 5min to 30min.

    This is not repeating everytime though, so need to find exact scenario in which it reproduces

    Version information

    • Signoz version: v0.5.2
    • Browser version: Chrome 96.0.4
    • Your OS and version: macOS Monterey

    Additional context

    https://share.getcloudapp.com/X6ubmGKE

    Thank you for your bug report – we love squashing them!

  • Improve clickhouse performance

    Improve clickhouse performance

    Hi, i'm playing a bit with signoz with Clickhouse as the backend the performance can be improved a lot

    in general, need to create MV in order to make queries more efficient and the main table structure should also change, and put timestamp as leading index(in general it can be done with projections, but did not see any need to use it)

    currently i have around 50m traces, and clickhouse server with 2 vcpu and 8GB RAM queries took between 5-6 seconds to run(some even 20 seconds)

    after my changes, most queries run under 500ms

    also, i did not want to include kafka, so i just created buffer table in clickhouse, it allows a lot of small insertions

    i needed to remove some filters in: SearchSpansAggregate method, but in general, it seems to work pretty well, i need to check on larger scale though(lets say 1 billion records)

    so in general(query service only): need to use MV and populate it most of queries should be performed in front of new aggregated table need to put timestamp to be leading index(or use projections) also, for collector, i would use buffer table

    i can provide working exmaple if needed, i guess it can be improved even more (i deleted druid funcitons from code though)

    tables:

    Buffer:
    CREATE TABLE otel.signoz_index
    (
        `timestamp` DateTime64(9) CODEC(Delta(8), ZSTD(1)),
        `traceID` String CODEC(ZSTD(1)),
        `spanID` String CODEC(ZSTD(1)),
        `parentSpanID` String CODEC(ZSTD(1)),
        `serviceName` LowCardinality(String) CODEC(ZSTD(1)),
        `name` LowCardinality(String) CODEC(ZSTD(1)),
        `kind` Int32 CODEC(ZSTD(1)),
        `durationNano` UInt64 CODEC(ZSTD(1)),
        `tags` Array(String) CODEC(ZSTD(1)),
        `tagsKeys` Array(String) CODEC(ZSTD(1)),
        `tagsValues` Array(String) CODEC(ZSTD(1)),
        `statusCode` Int64 CODEC(ZSTD(1)),
        `references` String CODEC(ZSTD(1)),
        `externalHttpMethod` Nullable(String) CODEC(ZSTD(1)),
        `externalHttpUrl` Nullable(String) CODEC(ZSTD(1)),
        `component` Nullable(String) CODEC(ZSTD(1)),
        `dbSystem` Nullable(String) CODEC(ZSTD(1)),
        `dbName` Nullable(String) CODEC(ZSTD(1)),
        `dbOperation` Nullable(String) CODEC(ZSTD(1)),
        `peerService` Nullable(String) CODEC(ZSTD(1))
    )
    ENGINE = Buffer('otel', 'signoz_index_final', 16, 0, 20, 0, 20000, 0, 10000000)
    
    main table:
    CREATE TABLE otel.signoz_index_final
    (
        `timestamp` DateTime64(9) CODEC(Delta(8), ZSTD(1)),
        `traceID` String CODEC(ZSTD(1)),
        `spanID` String CODEC(ZSTD(1)),
        `parentSpanID` String CODEC(ZSTD(1)),
        `serviceName` LowCardinality(String) CODEC(ZSTD(1)),
        `name` LowCardinality(String) CODEC(ZSTD(1)),
        `kind` Int32 CODEC(ZSTD(1)),
        `durationNano` UInt64 CODEC(ZSTD(1)),
        `tags` Array(String) CODEC(ZSTD(1)),
        `tagsKeys` Array(String) CODEC(ZSTD(1)),
        `tagsValues` Array(String) CODEC(ZSTD(1)),
        `statusCode` Int64 CODEC(ZSTD(1)),
        `references` String CODEC(ZSTD(1)),
        `externalHttpMethod` Nullable(String) CODEC(ZSTD(1)),
        `externalHttpUrl` Nullable(String) CODEC(ZSTD(1)),
        `component` Nullable(String) CODEC(ZSTD(1)),
        `dbSystem` Nullable(String) CODEC(ZSTD(1)),
        `dbName` Nullable(String) CODEC(ZSTD(1)),
        `dbOperation` Nullable(String) CODEC(ZSTD(1)),
        `peerService` Nullable(String) CODEC(ZSTD(1)),
        INDEX idx_traceID traceID TYPE bloom_filter GRANULARITY 4,
        INDEX idx_service serviceName TYPE bloom_filter GRANULARITY 4,
        INDEX idx_spanID spanID TYPE bloom_filter GRANULARITY 64,
        INDEX idx_tagsKeys tagsKeys TYPE bloom_filter(0.01) GRANULARITY 64,
        INDEX idx_tagsKeys_arr arrayJoin(tagsKeys) TYPE bloom_filter GRANULARITY 64,
        INDEX idx_tagsValues tagsValues TYPE bloom_filter(0.01) GRANULARITY 64,
        INDEX idx_duration durationNano TYPE minmax GRANULARITY 1
    )
    ENGINE = MergeTree
    PARTITION BY toDate(timestamp)
    ORDER BY (timestamp, serviceName)
    SETTINGS index_granularity = 8192
    
    Aggregated table:
    CREATE TABLE otel.signoz_index_aggregated
    (
        `timestamp` DateTime CODEC(Delta(8), ZSTD(1)),
        `serviceName` LowCardinality(String) CODEC(ZSTD(1)),
        `statusCode` Int64 CODEC(ZSTD(1)),
        `kind` Int32 CODEC(ZSTD(1)),
        `name` LowCardinality(String) CODEC(ZSTD(1)),
        `dbSystem` Nullable(String) CODEC(ZSTD(1)),
        `dbName` Nullable(String) CODEC(ZSTD(1)),
        `externalHttpMethod` Nullable(String) CODEC(ZSTD(1)),
        `externalHttpUrl` Nullable(String) CODEC(ZSTD(1)),
        `count` Int32,
        `avg` AggregateFunction(avg, UInt64),
        `quantile` AggregateFunction(quantile, UInt64),
        `tagsKeys` Array(String) CODEC(ZSTD(1))
    )
    ENGINE = SummingMergeTree
    PARTITION BY toYYYYMMDD(timestamp)
    ORDER BY (serviceName, kind, statusCode, -toUnixTimestamp(timestamp))
    SETTINGS index_granularity = 8192
  • No Traces

    No Traces

    Greetings, I'm running the signoz with the lateset opentelemetry-python v1.12.0rc2 in docker. Signoz is running with the demo I'm not getting traces from my sample python flask app. If I run:

    OTEL_RESOURCE_ATTRIBUTES=service.name="inspired" OTEL_EXPORTER_OTLP_ENDPOINT="localhost:4318" opentelemetry-instrument --traces_exporter otlp_proto_http,console flask run

    I see the output on the console but nothing shows on the Signoz frontend.

    the python app:

    from opentelemetry import trace
    from opentelemetry.exporter.jaeger.thrift import JaegerExporter
    from opentelemetry.sdk.trace import TracerProvider
    from opentelemetry.sdk.trace.export import BatchSpanProcessor, ConsoleSpanExporter
    from opentelemetry.sdk.resources import SERVICE_NAME, Resource
    
    from random import randint
    from flask import Flask, request
    from time import sleep
    from sys import exit
    
    ################# Metrics Start
    from opentelemetry import metrics
    from opentelemetry.sdk.metrics import MeterProvider
    from opentelemetry.sdk.metrics.export import (ConsoleMetricExporter, PeriodicExportingMetricReader,)
    
    metric_reader = PeriodicExportingMetricReader(ConsoleMetricExporter())
    provider = MeterProvider(metric_readers=[metric_reader])
    
    # Sets the global default meter provider
    metrics.set_meter_provider(provider)
    
    # Creates a meter from the global meter provider
    meter = metrics.get_meter(__name__)
    ################# Metrics end


    # Service name is required for most backends,
    # and although it's not necessary for console export,
    # it's good to set service name anyways.
    resource = Resource(attributes={
        SERVICE_NAME: "inspired"
    })
    '''
    provider = TracerProvider()
    trace.set_tracer_provider(provider)
    tracer = trace.get_tracer(__name__)
    '''
    provider = TracerProvider(resource=resource)
    processor = BatchSpanProcessor(ConsoleSpanExporter())
    provider.add_span_processor(processor)
    trace.set_tracer_provider(provider)
    tracer = trace.get_tracer(__name__)
    
    app = Flask(__name__)
    
    @app.route("/roll")
    def roll():
        sides = int(request.args.get('sides'))
        rolls = int(request.args.get('rolls'))
        sides = 6
        rolls = 1
        total = 0
        while True:
            with tracer.start_as_current_span("roll_sum01"):
                span = trace.get_current_span()
                sum01 = 0
                for r in range(0,1):
                    result = randint(1,6)
                    span.add_event( "log", {
                        "roll.sides": sides,
                        "roll.result": result,
                    })
                    sum01 += result
                    total += result
                with tracer.start_as_current_span("roll_sum02"):
                    span = trace.get_current_span()
                    sum02 = 0
                    for r in range(0,1):
                        result = randint(1,6)
                        span.add_event( "log", {
                            "roll.sides": sides,
                            "roll.result": result,
                        })
                        sum02 += result
                        total += result
                    with tracer.start_as_current_span("roll_sum03"):
                        span = trace.get_current_span()
                        sum03 = 0
                        for r in range(0,1):
                            result = randint(1,6)
                            span.add_event( "log", {
                                "roll.sides": sides,
                                "roll.result": result,
                            })
                            sum03 += result
                            total += result
                        with tracer.start_as_current_span("roll_total"):
                            span = trace.get_current_span()
                            span.add_event( "log", {
                                "roll.total": total,
                            })
                            sleep(5)
            # return  str(f'{sum01},{sum02},{sum03}')


    the otel-collector-config.yaml:

    receivers:
      otlp/spanmetrics:
        protocols:
          grpc:
            endpoint: "localhost:12345"
      otlp:
        protocols:
          grpc:
            endpoint: "localhost:4137"
          http:
            endpoint: "localhost:4138"
      jaeger:
        protocols:
          grpc:
          thrift_http:
      hostmetrics:
        collection_interval: 60s
        scrapers:
          cpu:
          load:
          memory:
          disk:
          filesystem:
          network:
    processors:
      batch:
        send_batch_size: 10000
        send_batch_max_size: 11000
        timeout: 10s
      signozspanmetrics/prometheus:
        metrics_exporter: prometheus
        latency_histogram_buckets: [100us, 1ms, 2ms, 6ms, 10ms, 50ms, 100ms, 250ms, 500ms, 1000ms, 1400ms, 2000ms, 5s, 10s, 20s, 40s, 60s ]
        dimensions_cache_size: 10000
        dimensions:
          - name: service.namespace
            default: default
          - name: deployment.environment
            default: default
      # memory_limiter:
      #   # 80% of maximum memory up to 2G
      #   limit_mib: 1500
      #   # 25% of limit up to 2G
      #   spike_limit_mib: 512
      #   check_interval: 5s
      #
      #   # 50% of the maximum memory
      #   limit_percentage: 50
      #   # 20% of max memory usage spike expected
      #   spike_limit_percentage: 20
      # queued_retry:
      #   num_workers: 4
      #   queue_size: 100
      #   retry_on_failure: true
    extensions:
      health_check: {}
      zpages: {}
    exporters:
      clickhousetraces:
        datasource: tcp://clickhouse:9000/?database=signoz_traces
      clickhousemetricswrite:
        endpoint: tcp://clickhouse:9000/?database=signoz_metrics
        resource_to_telemetry_conversion:
          enabled: true
      prometheus:
        endpoint: "0.0.0.0:8889"
    service:
      extensions: [health_check, zpages]
      pipelines:
        traces:
          receivers: [jaeger, otlp]
          processors: [signozspanmetrics/prometheus, batch]
          exporters: [clickhousetraces]
        metrics:
          receivers: [otlp, hostmetrics]
          processors: [batch]
          exporters: [clickhousemetricswrite]
        metrics/spanmetrics:
          receivers: [otlp/spanmetrics]
          exporters: [prometheus]
    
    
  • OTLP HTTP/1.0 receiver not found in otel collector service

    OTLP HTTP/1.0 receiver not found in otel collector service

    Hi, I lost the OTLP HTTP/1.0 receiver, after upgrading otel collector service to latest signoz/otelcontribcol:0.43.0 version.

    Now I could only use OTLP GRPC receiver port at 4317.

    Earlier I was using OTLP HTTP/1.0 receiver at 55681.

    Found different in the docker-compose port expose for otel-collector service:

    Earlier:-

        ports:
          - "1777:1777"   # pprof extension
          - "8887:8888"   # Prometheus metrics exposed by the agent
          - "14268:14268"       # Jaeger receiver
          - "55678"       # OpenCensus receiver
          - "55680:55680"       # OTLP HTTP/2.0 legacy port
          - "55681:55681"       # OTLP HTTP/1.0 receiver
          - "4317:4317"       # OTLP GRPC receiver
          - "55679:55679" # zpages extension
          - "13133"       # health_check
          - "8889:8889"   # prometheus exporter
    

    Now:-

        ports:
          - "4317:4317"       # OTLP GRPC receiver
    

    Please help, Thanks.

  • add exception page filters support

    add exception page filters support

    Closes https://github.com/SigNoz/signoz/issues/1893

    The filter keywords should be exact. Example: To filter exception type IOError the filter should be IOError, writing just Error or IO won't work. i.e. There's no fuzzy filtering.

  • Error % shown in metrics detail page and in Services List page is different

    Error % shown in metrics detail page and in Services List page is different

    Sometimes the values shown in Error Percentage panel in application detail page doesn't match with the Error % shown in services list page for that application

  • Recheck all table creation and dynamic queries for distributed setup

    Recheck all table creation and dynamic queries for distributed setup

    • [x] metrics @srikanthccv. Eg https://github.com/SigNoz/signoz-otel-collector/pull/34
    • [x] traces @makeavish https://github.com/SigNoz/signoz/issues/1781
    • [x] logs @nityanandagohain. Eg https://github.com/SigNoz/signoz-otel-collector/pull/22
  • Unable to see the actual span for multiple spans in traces Page

    Unable to see the actual span for multiple spans in traces Page

    Bug description

    Unable to see problematic spans in case span number exceeds a certain threshold More details: https://drive.google.com/file/d/1JVUSX9OPl32dDFYHcMQKdaOxlHPcHdw1/view?usp=share_link

    Expected behavior

    There should be a way to scroll horizontally not just vertically

    Or atleast be able to click on the problematic span

    How to reproduce

    Check https://drive.google.com/file/d/1JVUSX9OPl32dDFYHcMQKdaOxlHPcHdw1/view?usp=share_link

  • chore(jest): setup jest for frontend

    chore(jest): setup jest for frontend

    Description

    The PR sets up jest tests in the repo with support of custom matchers from React Testing library.

    Closes https://github.com/SigNoz/signoz/issues/312

    How to Test?

    1. Run cd ./frontend
    2. Run command yarn test
    3. This will run a sample test added for NotFound page.
    4. Run command yarn test:coverage
    5. This will run a sample test added for NotFound page along with coverage report which this test was able to capture.
  • No logs found error due to same start and end timestamp

    No logs found error due to same start and end timestamp

    Steps

    • Open a new browser (important)
    • Open Signoz logs
    • Press next -> previous -> previous
    • Results in no logs found

    image

    Interestingly it doesn't happen all the time.

  • Kubernetes pods logs are not being parsed

    Kubernetes pods logs are not being parsed

    Bug description

    Kubernetes pods logs are not being parsed. Their content is included in the body property instead of being parsed. In the screenshot we can see span_id and trace_id are not being extracted from the log message.

    image

    Expected behavior

    Logs content should be parsed and values like trace_id and span_id should not be empty.

    How to reproduce

    1. Deploy Signoz helm chart into a kubernetes cluster
    2. Deploy a fastify (nodejs webserver) application, which uses pino as its logger, with opentelemetry auto-instrumentation
    3. See logs in the frontend

    Version information

    • Signoz version: 0.12.0
    • Browser version: Safari and latest Chrome
    • Your OS and version: MacOS Monterey (12.5.1)
    • Your CPU Architecture(ARM/Intel):

    Thank you for your bug report – we love squashing them!

  • Can't see Kubernetes pods logs

    Can't see Kubernetes pods logs

    Bug description

    When I deploy default helm chart to my k8s cluster, I can't see logs in "Logs page"

    • I have no errors in k8s with pods.
    NAME                                                 READY   STATUS    RESTARTS   AGE
    chi-signoze-clickhouse-cluster-0-0-0                 1/1     Running   0          3h4m
    signoze-alertmanager-0                               1/1     Running   0          3h4m
    signoze-clickhouse-operator-7df76c4787-967gq         2/2     Running   0          3h4m
    signoze-frontend-68db584964-zx4t4                    1/1     Running   0          3h4m
    signoze-k8s-infra-otel-agent-24cwz                   1/1     Running   0          10m
    signoze-k8s-infra-otel-agent-bm94b                   1/1     Running   0          10m
    signoze-k8s-infra-otel-agent-r2gwz                   1/1     Running   0          10m
    signoze-k8s-infra-otel-agent-v2k5t                   1/1     Running   0          10m
    signoze-k8s-infra-otel-deployment-5cf565ffc5-zms4v   1/1     Running   0          22m
    signoze-otel-collector-89f968c9d-bd8q7               1/1     Running   0          26m
    signoze-otel-collector-metrics-7547bc8db7-ll55h      1/1     Running   0          3h4m
    signoze-query-service-0                              1/1     Running   0          3h4m
    signoze-zookeeper-0
    

    Expected behavior

    I suggest that if I deploy default chart it will be working.

    How to reproduce

    1. helm pull signoz/signoz --untar
    2. helm upgrade --install --create-namespace -n signoze -f values.yaml signoze .
    3. try to find logs in frontend

    Version information

    • Signoz version: 0.12.0
    • Chart version: 0.6.0

    Additional context

    May be it helps Errors: Otel-collector:

    2022-12-28T14:18:19.597Z warn zapgrpc/zapgrpc.go:191 [transport] transport: http2Server.HandleStreams failed to read frame: read tcp 192.168.12.254:4317->192.168.0.150:37728: read: connection reset by peer {"grpc_log": true}
    2022-12-28T14:25:38.720Z warn zapgrpc/zapgrpc.go:191 [transport] transport: http2Server.HandleStreams failed to read frame: read tcp 192.168.12.254:4317->192.168.0.179:58316: read: connection timed out {"grpc_log": true}
    2022-12-28T14:25:38.720Z warn zapgrpc/zapgrpc.go:191 [transport] transport: http2Server.HandleStreams failed to read frame: read tcp 192.168.12.254:4317->192.168.0.179:58312: read: connection timed out {"grpc_log": true}
    
  • ci(deployments): workflows for staging and testing deployments and related changes

    ci(deployments): workflows for staging and testing deployments and related changes

    • docker-standalone: introduce tag environment variables for easy custom deployments
    • Makefile: remove no-cache from all docker build commands
    • Makefile: update target names
      • run-x86 to run-signoz
      • down-x86 to down-signoz
    • Makefile: introduce pull-signoz to pull latest image from standalone docker-compose YAML

    Signed-off-by: Prashant Shahi [email protected]

Chanman helps you to create queue channels and manage them gracefully.

chanman Channels are widely used as queues. chanman (Channel Manager) helps you to easily create queue with channel and manage the data in the queue.

Oct 16, 2021
An opinionated package that helps you print user-friendly output messages from your Go command line applications.

github.com/eth-p/clout (Command Line Output) clout is a package that helps you print user-friendly output messages from your Go command line applicati

Jan 15, 2022
The Xiaomi message push service is a system-level channel on MIUI and is universal across the platform, which can provide developers with stable, reliable, and efficient push services.

Go-Push-API MiPush、JiPush、UMeng MiPush The Xiaomi message push service is a system-level channel on MIUI and is universal across the platform, which c

Oct 20, 2022
Uniqush is a free and open source software system which provides a unified push service for server side notification to apps on mobile devices.

Homepage Download Blog/News @uniqush Introduction Uniqush (\ˈyü-nə-ku̇sh\ "uni" pronounced as in "unified", and "qush" pronounced as in "cushion") is

Jan 9, 2023
Build event-driven and event streaming applications with ease

Commander ?? Commander is Go library for writing event-driven applications. Enabling event sourcing, RPC over messages, SAGA's, bidirectional streamin

Dec 19, 2022
:incoming_envelope: A fast Message/Event Hub using publish/subscribe pattern with support for topics like* rabbitMQ exchanges for Go applications

Hub ?? A fast enough Event Hub for go applications using publish/subscribe with support patterns on topics like rabbitMQ exchanges. Table of Contents

Dec 17, 2022
Inspr is an application mesh for simple, fast and secure development of distributed applications.

Inspr is an engine for running distributed applications, using multiple communication patterns such as pub sub and more, focused on type consistency a

Jun 10, 2022
Go library to build event driven applications easily using AMQP as a backend.

event Go library to build event driven applications easily using AMQP as a backend. Publisher package main import ( "github.com/creekorful/event" "

Dec 5, 2021
Streamhub: a toolkit crafted for streaming-powered applications written in Go

✉️ Streamhub Streamhub is a toolkit crafted for streaming-powered applications w

Jun 4, 2022
May 11, 2023
Give it an URI and it will open it how you want.

url_handler Give it an url and it will open it how you want. Browers are anoying so when I can, I open links with dedicated programs. I started out us

Jan 8, 2022
A Github action that notifies PR's that are open longer than X days

PR notifier Use GitHub Actions to notify Slack that a pull request is opened since DAYS_BEFORE days. Usage Add the following YAML to your new GitHub A

Apr 8, 2022
A realtime distributed messaging platform

Source: https://github.com/nsqio/nsq Issues: https://github.com/nsqio/nsq/issues Mailing List: [email protected] IRC: #nsq on freenode Docs:

Dec 29, 2022
The Bhojpur MDM is a software-as-a-service product used as a Mobile Device Manager based on Bhojpur.NET Platform for application delivery.

Bhojpur MDM - Mobile Device Manager The Bhojpur MDM is a software-as-a-service product used as a Mobile Device Manager based on Bhojpur.NET Platform f

Dec 31, 2021
Govent is an event bus framework for DDD event source implement

Govent is an event bus framework for DDD event source implement. Govent can also solve the package circular dependency problem.

Jan 28, 2022
SigNoz helps developers monitor their applications & troubleshoot problems, an open-source alternative to DataDog, NewRelic, etc. 🔥 🖥. 👉 Open source Application Performance Monitoring (APM) & Observability tool
SigNoz helps developers monitor their applications & troubleshoot problems, an open-source alternative to DataDog, NewRelic, etc. 🔥 🖥.   👉  Open source Application Performance Monitoring (APM) & Observability tool

Monitor your applications and troubleshoot problems in your deployed applications, an open-source alternative to DataDog, New Relic, etc. Documentatio

Sep 24, 2021
SigNoz helps developer monitor applications and troubleshoot problems in their deployed applications

SigNoz helps developers monitor their applications & troubleshoot problems, an open-source alternative to DataDog, NewRelic, etc. ?? ??

Dec 27, 2022
A Master list of Go Programming Tutorials, their write-ups, their source code and their current build status!

TutorialEdge TutorialEdge.net Go Tutorials ??‍?? ??‍?? Welcome to the TutorialEdge Go Repository! The goal of this repo is to be able to keep track of

Dec 18, 2022
ip-masq-agent-v2 aims to solve more specific networking cases, allow for more configuration options, and improve observability compared to the original.

ip-masq-agent-v2 Based on the original ip-masq-agent, v2 aims to solve more specific networking cases, allow for more configuration options, and impro

Aug 31, 2022
An open-source, distributed, cloud-native CD (Continuous Delivery) product designed for developersAn open-source, distributed, cloud-native CD (Continuous Delivery) product designed for developers

Developer-oriented Continuous Delivery Product ⁣ English | 简体中文 Table of Contents Zadig Table of Contents What is Zadig Quick start How to use? How to

Oct 19, 2021