nvidia_gpu_exporter
![]()


Nvidia GPU exporter for prometheus, using nvidia-smi binary to gather metrics.
Introduction
There are many Nvidia GPU exporters out there however they have problems such as not being maintained, not providing pre-built binaries, having a dependency to Linux and/or Docker, targeting enterprise setups (DCGM) and so on.
This is a simple exporter that uses nvidia-smi(.exe) binary to collect, parse and export metrics. This makes it possible to run it on Windows and get GPU metrics while gaming - no Docker or Linux required.
This project is based on a0s/nvidia-smi-exporter. However, this one is written in Go to produce a single, static binary.
If you are a gamer who's into monitoring, you are in for a treat.
Highlights
- Will work on any system that has
nvidia-smi(.exe)?binary - Windows, Linux, MacOS... No C bindings required - Doesn't even need to run the monitored machine: can be configured to execute
nvidia-smicommand remotely - No need for a Docker or Kubernetes environment
- Auto-discovery of the metric fields
nvidia-smican expose (future-compatible) - Comes with its own Grafana dashboard
Visualization
You can use the official Grafana dashboard to see your GPU metrics in a nicely visualized way.
Here's how it looks like: 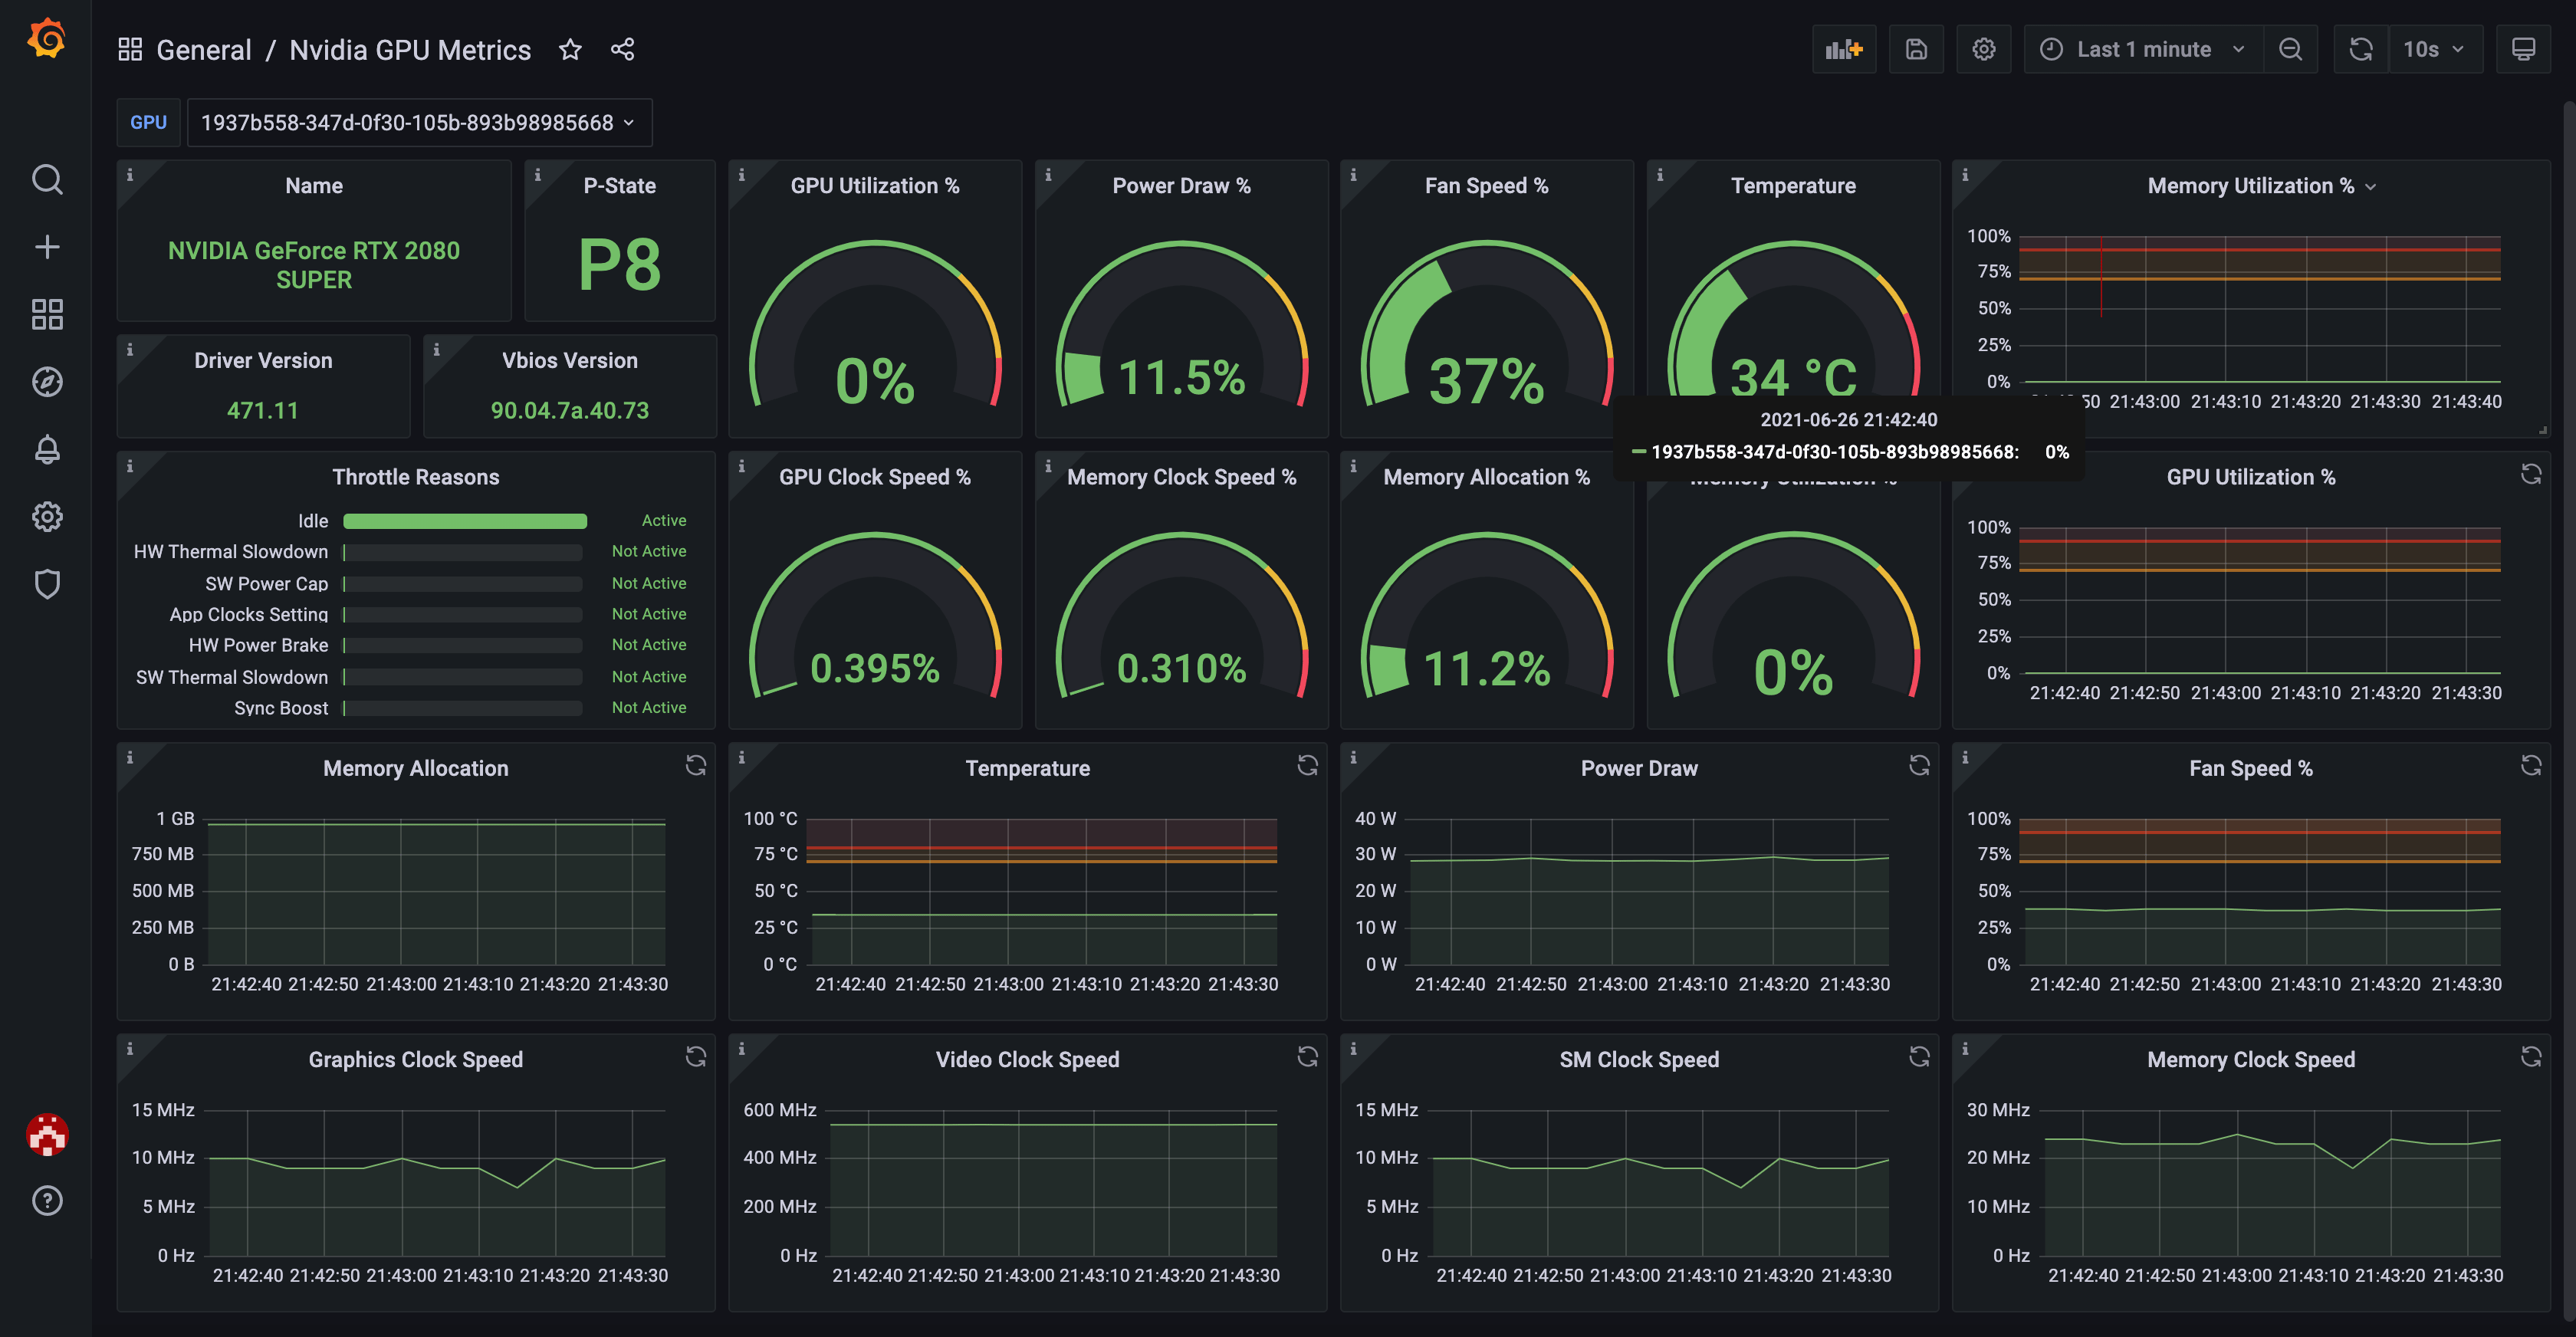
Installation
By downloading the binaries (MacOS/Linux/Windows)
- Go to the releases and download the latest release archive for your platform.
- Extract the archive.
- Move the binary to somewhere in your
PATH.
Sample steps for Linux 64-bit:
$ VERSION=0.2.0
$ wget https://github.com/utkuozdemir/nvidia_gpu_exporter/releases/download/v${VERSION}/nvidia_gpu_exporter_${VERSION}_linux_x86_64.tar.gz
$ tar -xvzf nvidia_gpu_exporter_${VERSION}_linux_x86_64.tar.gz
$ mv nvidia_gpu_exporter /usr/local/bin
$ nvidia_gpu_exporter --help
Installing as a Windows Service
Requirements:
- Scoop package manager
- NSSM (get the latest pre-release version)
Installation steps:
- Open a privileged powershell prompt (right click - Run as administrator)
- Run the following commands:
scoop bucket add nvidia_gpu_exporter https://github.com/utkuozdemir/scoop_nvidia_gpu_exporter.git
scoop install nvidia_gpu_exporter/nvidia_gpu_exporter --global
New-NetFirewallRule -DisplayName "Nvidia GPU Exporter" -Direction Inbound -Action Allow -Protocol TCP -LocalPort 9835
nssm install nvidia_gpu_exporter "C:\ProgramData\scoop\apps\nvidia_gpu_exporter\current\nvidia_gpu_exporter.exe"
Start-Service nvidia_gpu_exporter
Installing as a Linux (Systemd) Service
If your Linux distro is using systemd, you can install the exporter as a service using the unit file provided.
Follow these simple steps:
- Download the Linux binary matching your CPU architecture and put it under
/usr/local/bindirectory. - Drop a copy of the file nvidia_gpu_exporter.service under
/etc/systemd/systemdirectory. - Run
sudo systemctl daemon-reload - Start and enable the service to run on boot:
sudo systemctl enable --now nvidia_gpu_exporter
Running in Docker
You can run the exporter in a Docker container.
For it to work, you will need to ensure the following:
- The
nvidia-smibinary is bind-mounted from the host to the container under itsPATH - The devices
/dev/nvidiaX(depends on the number of GPUs you have) and/dev/nvidiactlare mounted into the container - The library files
libnvidia-ml.soandlibnvidia-ml.so.1are mounted inside the container. They are typically found under/usr/lib/x86_64-linux-gnu/or/usr/lib/i386-linux-gnu/. Locate them in your host to ensure you are mounting them from the correct path.
A working example with all these combined (tested in Ubuntu 20.04):
docker run -d \
--name nvidia_smi_exporter \
--restart unless-stopped \
--device /dev/nvidiactl:/dev/nvidiactl \
--device /dev/nvidia0:/dev/nvidia0 \
-v /usr/lib/x86_64-linux-gnu/libnvidia-ml.so:/usr/lib/x86_64-linux-gnu/libnvidia-ml.so \
-v /usr/lib/x86_64-linux-gnu/libnvidia-ml.so.1:/usr/lib/x86_64-linux-gnu/libnvidia-ml.so.1 \
-v /usr/bin/nvidia-smi:/usr/bin/nvidia-smi \
-p 9835:9835 \
utkuozdemir/nvidia_gpu_exporter:0.2.0
Running in Kubernetes
Using the exporter in Kubernetes is pretty similar with running it in Docker.
You can use the official helm chart to install the exporter.
The chart was tested on the following configuration:
- Ubuntu Desktop 20.04 with Kernel
5.8.0-55-generic - K3s
v1.21.1+k3s1 - Nvidia GeForce RTX 2080 Super
- Nvidia Driver version
465.27
Note: I didn't have chance to test it on an enterprise cluster with GPU support. If you have access to one and give the exporter a try and share the results, I would appreciate it greatly.
Command Line Reference
The exporter binary accepts the following arguments:
usage: nvidia_gpu_exporter [<flags>]

Flags:
  -h, --help                Show context-sensitive help (also try --help-long and --help-man).
      --web.config.file=""  [EXPERIMENTAL] Path to configuration file that can enable TLS or authentication.
      --web.listen-address=":9835"
                            Address to listen on for web interface and telemetry.
      --web.telemetry-path="/metrics"
                            Path under which to expose metrics.
      --nvidia-smi-command="nvidia-smi"
                            Path or command to be used for the nvidia-smi executable
      --query-field-names="AUTO"
                            Comma-separated list of the query fields. You can find out possible fields by running `nvidia-smi --help-query-gpus`. The value `AUTO` will
                            automatically detect the fields to query.
      --log.level=info      Only log messages with the given severity or above. One of: [debug, info, warn, error]
      --log.format=logfmt   Output format of log messages. One of: [logfmt, json]
      --version             Show application version.
Remote scraping configuration
The exporter can be configured to scrape metrics from a remote machine.
An example use case is running the exporter in a Raspberry Pi in your home network while scraping the metrics from your PC over SSH.
The exporter supports arbitrary commands with arguments to produce nvidia-smi-like output. Therefore, configuration is pretty straightforward.
Simply override the --nvidia-smi-command command-line argument (replace SSH_USER and SSH_HOST with SSH credentials):
nvidia_gpu_exporter --nvidia-smi-command "ssh -o StrictHostKeyChecking=no -o UserKnownHostsFile=/dev/null SSH_USER@SSH_HOST nvidia-smi"
Metrics
This is a sample, incomplete output of the returned metrics. In AUTO query fields mode, the exporter will discover new fields and expose them on a best-effort basis.
# HELP go_gc_duration_seconds A summary of the pause duration of garbage collection cycles.
# TYPE go_gc_duration_seconds summary
go_gc_duration_seconds{quantile="0"} 0
go_gc_duration_seconds{quantile="0.25"} 0
go_gc_duration_seconds{quantile="0.5"} 0
go_gc_duration_seconds{quantile="0.75"} 0
go_gc_duration_seconds{quantile="1"} 0
go_gc_duration_seconds_sum 0
go_gc_duration_seconds_count 0
# HELP go_goroutines Number of goroutines that currently exist.
# TYPE go_goroutines gauge
go_goroutines 7
# HELP go_info Information about the Go environment.
# TYPE go_info gauge
go_info{version="go1.16.5"} 1
# HELP go_memstats_alloc_bytes Number of bytes allocated and still in use.
# TYPE go_memstats_alloc_bytes gauge
go_memstats_alloc_bytes 1.169224e+06
# HELP go_memstats_alloc_bytes_total Total number of bytes allocated, even if freed.
# TYPE go_memstats_alloc_bytes_total counter
go_memstats_alloc_bytes_total 1.169224e+06
# HELP go_memstats_buck_hash_sys_bytes Number of bytes used by the profiling bucket hash table.
# TYPE go_memstats_buck_hash_sys_bytes gauge
go_memstats_buck_hash_sys_bytes 1.44498e+06
# HELP go_memstats_frees_total Total number of frees.
# TYPE go_memstats_frees_total counter
go_memstats_frees_total 273
# HELP go_memstats_gc_cpu_fraction The fraction of this program's available CPU time used by the GC since the program started.
# TYPE go_memstats_gc_cpu_fraction gauge
go_memstats_gc_cpu_fraction 0
# HELP go_memstats_gc_sys_bytes Number of bytes used for garbage collection system metadata.
# TYPE go_memstats_gc_sys_bytes gauge
go_memstats_gc_sys_bytes 4.110176e+06
# HELP go_memstats_heap_alloc_bytes Number of heap bytes allocated and still in use.
# TYPE go_memstats_heap_alloc_bytes gauge
go_memstats_heap_alloc_bytes 1.169224e+06
# HELP go_memstats_heap_idle_bytes Number of heap bytes waiting to be used.
# TYPE go_memstats_heap_idle_bytes gauge
go_memstats_heap_idle_bytes 6.397952e+07
# HELP go_memstats_heap_inuse_bytes Number of heap bytes that are in use.
# TYPE go_memstats_heap_inuse_bytes gauge
go_memstats_heap_inuse_bytes 2.637824e+06
# HELP go_memstats_heap_objects Number of allocated objects.
# TYPE go_memstats_heap_objects gauge
go_memstats_heap_objects 6126
# HELP go_memstats_heap_released_bytes Number of heap bytes released to OS.
# TYPE go_memstats_heap_released_bytes gauge
go_memstats_heap_released_bytes 6.397952e+07
# HELP go_memstats_heap_sys_bytes Number of heap bytes obtained from system.
# TYPE go_memstats_heap_sys_bytes gauge
go_memstats_heap_sys_bytes 6.6617344e+07
# HELP go_memstats_last_gc_time_seconds Number of seconds since 1970 of last garbage collection.
# TYPE go_memstats_last_gc_time_seconds gauge
go_memstats_last_gc_time_seconds 0
# HELP go_memstats_lookups_total Total number of pointer lookups.
# TYPE go_memstats_lookups_total counter
go_memstats_lookups_total 0
# HELP go_memstats_mallocs_total Total number of mallocs.
# TYPE go_memstats_mallocs_total counter
go_memstats_mallocs_total 6399
# HELP go_memstats_mcache_inuse_bytes Number of bytes in use by mcache structures.
# TYPE go_memstats_mcache_inuse_bytes gauge
go_memstats_mcache_inuse_bytes 9600
# HELP go_memstats_mcache_sys_bytes Number of bytes used for mcache structures obtained from system.
# TYPE go_memstats_mcache_sys_bytes gauge
go_memstats_mcache_sys_bytes 16384
# HELP go_memstats_mspan_inuse_bytes Number of bytes in use by mspan structures.
# TYPE go_memstats_mspan_inuse_bytes gauge
go_memstats_mspan_inuse_bytes 46240
# HELP go_memstats_mspan_sys_bytes Number of bytes used for mspan structures obtained from system.
# TYPE go_memstats_mspan_sys_bytes gauge
go_memstats_mspan_sys_bytes 49152
# HELP go_memstats_next_gc_bytes Number of heap bytes when next garbage collection will take place.
# TYPE go_memstats_next_gc_bytes gauge
go_memstats_next_gc_bytes 4.473924e+06
# HELP go_memstats_other_sys_bytes Number of bytes used for other system allocations.
# TYPE go_memstats_other_sys_bytes gauge
go_memstats_other_sys_bytes 885044
# HELP go_memstats_stack_inuse_bytes Number of bytes in use by the stack allocator.
# TYPE go_memstats_stack_inuse_bytes gauge
go_memstats_stack_inuse_bytes 491520
# HELP go_memstats_stack_sys_bytes Number of bytes obtained from system for stack allocator.
# TYPE go_memstats_stack_sys_bytes gauge
go_memstats_stack_sys_bytes 491520
# HELP go_memstats_sys_bytes Number of bytes obtained from system.
# TYPE go_memstats_sys_bytes gauge
go_memstats_sys_bytes 7.36146e+07
# HELP go_threads Number of OS threads created.
# TYPE go_threads gauge
go_threads 8
# HELP nvidia_gpu_exporter_build_info A metric with a constant '1' value labeled by version, revision, branch, and goversion from which nvidia_gpu_exporter was built.
# TYPE nvidia_gpu_exporter_build_info gauge
nvidia_gpu_exporter_build_info{branch="",goversion="go1.16.5",revision="",version=""} 1
# HELP nvidia_smi_accounting_buffer_size accounting.buffer_size
# TYPE nvidia_smi_accounting_buffer_size gauge
nvidia_smi_accounting_buffer_size{uuid="df6e7a7c-7314-46f8-abc4-b88b36dcf3aa"} 4000
# HELP nvidia_smi_accounting_mode accounting.mode
# TYPE nvidia_smi_accounting_mode gauge
nvidia_smi_accounting_mode{uuid="df6e7a7c-7314-46f8-abc4-b88b36dcf3aa"} 0
# HELP nvidia_smi_clocks_current_graphics_clock_hz clocks.current.graphics [MHz]
# TYPE nvidia_smi_clocks_current_graphics_clock_hz gauge
nvidia_smi_clocks_current_graphics_clock_hz{uuid="df6e7a7c-7314-46f8-abc4-b88b36dcf3aa"} 6e+06
# HELP nvidia_smi_clocks_current_memory_clock_hz clocks.current.memory [MHz]
# TYPE nvidia_smi_clocks_current_memory_clock_hz gauge
nvidia_smi_clocks_current_memory_clock_hz{uuid="df6e7a7c-7314-46f8-abc4-b88b36dcf3aa"} 1.6e+07
# HELP nvidia_smi_clocks_current_sm_clock_hz clocks.current.sm [MHz]
# TYPE nvidia_smi_clocks_current_sm_clock_hz gauge
nvidia_smi_clocks_current_sm_clock_hz{uuid="df6e7a7c-7314-46f8-abc4-b88b36dcf3aa"} 6e+06
# HELP nvidia_smi_clocks_current_video_clock_hz clocks.current.video [MHz]
# TYPE nvidia_smi_clocks_current_video_clock_hz gauge
nvidia_smi_clocks_current_video_clock_hz{uuid="df6e7a7c-7314-46f8-abc4-b88b36dcf3aa"} 5.4e+08
# HELP nvidia_smi_clocks_max_graphics_clock_hz clocks.max.graphics [MHz]
# TYPE nvidia_smi_clocks_max_graphics_clock_hz gauge
nvidia_smi_clocks_max_graphics_clock_hz{uuid="df6e7a7c-7314-46f8-abc4-b88b36dcf3aa"} 2.28e+09
# HELP nvidia_smi_clocks_max_memory_clock_hz clocks.max.memory [MHz]
# TYPE nvidia_smi_clocks_max_memory_clock_hz gauge
nvidia_smi_clocks_max_memory_clock_hz{uuid="df6e7a7c-7314-46f8-abc4-b88b36dcf3aa"} 7.751e+09
# HELP nvidia_smi_clocks_max_sm_clock_hz clocks.max.sm [MHz]
# TYPE nvidia_smi_clocks_max_sm_clock_hz gauge
nvidia_smi_clocks_max_sm_clock_hz{uuid="df6e7a7c-7314-46f8-abc4-b88b36dcf3aa"} 2.28e+09
# HELP nvidia_smi_clocks_throttle_reasons_active clocks_throttle_reasons.active
# TYPE nvidia_smi_clocks_throttle_reasons_active gauge
nvidia_smi_clocks_throttle_reasons_active{uuid="df6e7a7c-7314-46f8-abc4-b88b36dcf3aa"} 4
# HELP nvidia_smi_clocks_throttle_reasons_applications_clocks_setting clocks_throttle_reasons.applications_clocks_setting
# TYPE nvidia_smi_clocks_throttle_reasons_applications_clocks_setting gauge
nvidia_smi_clocks_throttle_reasons_applications_clocks_setting{uuid="df6e7a7c-7314-46f8-abc4-b88b36dcf3aa"} 0
# HELP nvidia_smi_clocks_throttle_reasons_gpu_idle clocks_throttle_reasons.gpu_idle
# TYPE nvidia_smi_clocks_throttle_reasons_gpu_idle gauge
nvidia_smi_clocks_throttle_reasons_gpu_idle{uuid="df6e7a7c-7314-46f8-abc4-b88b36dcf3aa"} 0
# HELP nvidia_smi_clocks_throttle_reasons_hw_power_brake_slowdown clocks_throttle_reasons.hw_power_brake_slowdown
# TYPE nvidia_smi_clocks_throttle_reasons_hw_power_brake_slowdown gauge
nvidia_smi_clocks_throttle_reasons_hw_power_brake_slowdown{uuid="df6e7a7c-7314-46f8-abc4-b88b36dcf3aa"} 0
# HELP nvidia_smi_clocks_throttle_reasons_hw_slowdown clocks_throttle_reasons.hw_slowdown
# TYPE nvidia_smi_clocks_throttle_reasons_hw_slowdown gauge
nvidia_smi_clocks_throttle_reasons_hw_slowdown{uuid="df6e7a7c-7314-46f8-abc4-b88b36dcf3aa"} 0
# HELP nvidia_smi_clocks_throttle_reasons_hw_thermal_slowdown clocks_throttle_reasons.hw_thermal_slowdown
# TYPE nvidia_smi_clocks_throttle_reasons_hw_thermal_slowdown gauge
nvidia_smi_clocks_throttle_reasons_hw_thermal_slowdown{uuid="df6e7a7c-7314-46f8-abc4-b88b36dcf3aa"} 0
# HELP nvidia_smi_clocks_throttle_reasons_supported clocks_throttle_reasons.supported
# TYPE nvidia_smi_clocks_throttle_reasons_supported gauge
nvidia_smi_clocks_throttle_reasons_supported{uuid="df6e7a7c-7314-46f8-abc4-b88b36dcf3aa"} 511
# HELP nvidia_smi_clocks_throttle_reasons_sw_power_cap clocks_throttle_reasons.sw_power_cap
# TYPE nvidia_smi_clocks_throttle_reasons_sw_power_cap gauge
nvidia_smi_clocks_throttle_reasons_sw_power_cap{uuid="df6e7a7c-7314-46f8-abc4-b88b36dcf3aa"} 1
# HELP nvidia_smi_clocks_throttle_reasons_sw_thermal_slowdown clocks_throttle_reasons.sw_thermal_slowdown
# TYPE nvidia_smi_clocks_throttle_reasons_sw_thermal_slowdown gauge
nvidia_smi_clocks_throttle_reasons_sw_thermal_slowdown{uuid="df6e7a7c-7314-46f8-abc4-b88b36dcf3aa"} 0
# HELP nvidia_smi_clocks_throttle_reasons_sync_boost clocks_throttle_reasons.sync_boost
# TYPE nvidia_smi_clocks_throttle_reasons_sync_boost gauge
nvidia_smi_clocks_throttle_reasons_sync_boost{uuid="df6e7a7c-7314-46f8-abc4-b88b36dcf3aa"} 0
# HELP nvidia_smi_compute_mode compute_mode
# TYPE nvidia_smi_compute_mode gauge
nvidia_smi_compute_mode{uuid="df6e7a7c-7314-46f8-abc4-b88b36dcf3aa"} 0
# HELP nvidia_smi_count count
# TYPE nvidia_smi_count gauge
nvidia_smi_count{uuid="df6e7a7c-7314-46f8-abc4-b88b36dcf3aa"} 1
# HELP nvidia_smi_display_active display_active
# TYPE nvidia_smi_display_active gauge
nvidia_smi_display_active{uuid="df6e7a7c-7314-46f8-abc4-b88b36dcf3aa"} 0
# HELP nvidia_smi_display_mode display_mode
# TYPE nvidia_smi_display_mode gauge
nvidia_smi_display_mode{uuid="df6e7a7c-7314-46f8-abc4-b88b36dcf3aa"} 1
# HELP nvidia_smi_driver_version driver_version
# TYPE nvidia_smi_driver_version gauge
nvidia_smi_driver_version{uuid="df6e7a7c-7314-46f8-abc4-b88b36dcf3aa"} 471.11
# HELP nvidia_smi_encoder_stats_average_fps encoder.stats.averageFps
# TYPE nvidia_smi_encoder_stats_average_fps gauge
nvidia_smi_encoder_stats_average_fps{uuid="df6e7a7c-7314-46f8-abc4-b88b36dcf3aa"} 0
# HELP nvidia_smi_encoder_stats_average_latency encoder.stats.averageLatency
# TYPE nvidia_smi_encoder_stats_average_latency gauge
nvidia_smi_encoder_stats_average_latency{uuid="df6e7a7c-7314-46f8-abc4-b88b36dcf3aa"} 0
# HELP nvidia_smi_encoder_stats_session_count encoder.stats.sessionCount
# TYPE nvidia_smi_encoder_stats_session_count gauge
nvidia_smi_encoder_stats_session_count{uuid="df6e7a7c-7314-46f8-abc4-b88b36dcf3aa"} 0
# HELP nvidia_smi_enforced_power_limit_watts enforced.power.limit [W]
# TYPE nvidia_smi_enforced_power_limit_watts gauge
nvidia_smi_enforced_power_limit_watts{uuid="df6e7a7c-7314-46f8-abc4-b88b36dcf3aa"} 250
# HELP nvidia_smi_fan_speed_ratio fan.speed [%]
# TYPE nvidia_smi_fan_speed_ratio gauge
nvidia_smi_fan_speed_ratio{uuid="df6e7a7c-7314-46f8-abc4-b88b36dcf3aa"} 0.38
# HELP nvidia_smi_gpu_info A metric with a constant '1' value labeled by gpu uuid, name, driver_model_current, driver_model_pending, vbios_version.
# TYPE nvidia_smi_gpu_info gauge
nvidia_smi_gpu_info{driver_model_current="WDDM",driver_model_pending="WDDM",name="NVIDIA GeForce RTX 2080 SUPER",uuid="df6e7a7c-7314-46f8-abc4-b88b36dcf3aa",vbios_version="90.04.7a.40.73"} 1
# HELP nvidia_smi_index index
# TYPE nvidia_smi_index gauge
nvidia_smi_index{uuid="df6e7a7c-7314-46f8-abc4-b88b36dcf3aa"} 0
# HELP nvidia_smi_inforom_oem inforom.oem
# TYPE nvidia_smi_inforom_oem gauge
nvidia_smi_inforom_oem{uuid="df6e7a7c-7314-46f8-abc4-b88b36dcf3aa"} 1.1
# HELP nvidia_smi_memory_free_bytes memory.free [MiB]
# TYPE nvidia_smi_memory_free_bytes gauge
nvidia_smi_memory_free_bytes{uuid="df6e7a7c-7314-46f8-abc4-b88b36dcf3aa"} 7.883194368e+09
# HELP nvidia_smi_memory_total_bytes memory.total [MiB]
# TYPE nvidia_smi_memory_total_bytes gauge
nvidia_smi_memory_total_bytes{uuid="df6e7a7c-7314-46f8-abc4-b88b36dcf3aa"} 8.589934592e+09
# HELP nvidia_smi_memory_used_bytes memory.used [MiB]
# TYPE nvidia_smi_memory_used_bytes gauge
nvidia_smi_memory_used_bytes{uuid="df6e7a7c-7314-46f8-abc4-b88b36dcf3aa"} 7.06740224e+08
# HELP nvidia_smi_name name
# TYPE nvidia_smi_name gauge
nvidia_smi_name{uuid="df6e7a7c-7314-46f8-abc4-b88b36dcf3aa"} 2080
# HELP nvidia_smi_pci_bus pci.bus
# TYPE nvidia_smi_pci_bus gauge
nvidia_smi_pci_bus{uuid="df6e7a7c-7314-46f8-abc4-b88b36dcf3aa"} 12
# HELP nvidia_smi_pci_device pci.device
# TYPE nvidia_smi_pci_device gauge
nvidia_smi_pci_device{uuid="df6e7a7c-7314-46f8-abc4-b88b36dcf3aa"} 0
# HELP nvidia_smi_pci_device_id pci.device_id
# TYPE nvidia_smi_pci_device_id gauge
nvidia_smi_pci_device_id{uuid="df6e7a7c-7314-46f8-abc4-b88b36dcf3aa"} 7809
# HELP nvidia_smi_pci_domain pci.domain
# TYPE nvidia_smi_pci_domain gauge
nvidia_smi_pci_domain{uuid="df6e7a7c-7314-46f8-abc4-b88b36dcf3aa"} 0
# HELP nvidia_smi_pci_sub_device_id pci.sub_device_id
# TYPE nvidia_smi_pci_sub_device_id gauge
nvidia_smi_pci_sub_device_id{uuid="df6e7a7c-7314-46f8-abc4-b88b36dcf3aa"} 1.074074712e+09
# HELP nvidia_smi_pcie_link_gen_current pcie.link.gen.current
# TYPE nvidia_smi_pcie_link_gen_current gauge
nvidia_smi_pcie_link_gen_current{uuid="df6e7a7c-7314-46f8-abc4-b88b36dcf3aa"} 3
# HELP nvidia_smi_pcie_link_gen_max pcie.link.gen.max
# TYPE nvidia_smi_pcie_link_gen_max gauge
nvidia_smi_pcie_link_gen_max{uuid="df6e7a7c-7314-46f8-abc4-b88b36dcf3aa"} 3
# HELP nvidia_smi_pcie_link_width_current pcie.link.width.current
# TYPE nvidia_smi_pcie_link_width_current gauge
nvidia_smi_pcie_link_width_current{uuid="df6e7a7c-7314-46f8-abc4-b88b36dcf3aa"} 16
# HELP nvidia_smi_pcie_link_width_max pcie.link.width.max
# TYPE nvidia_smi_pcie_link_width_max gauge
nvidia_smi_pcie_link_width_max{uuid="df6e7a7c-7314-46f8-abc4-b88b36dcf3aa"} 16
# HELP nvidia_smi_power_default_limit_watts power.default_limit [W]
# TYPE nvidia_smi_power_default_limit_watts gauge
nvidia_smi_power_default_limit_watts{uuid="df6e7a7c-7314-46f8-abc4-b88b36dcf3aa"} 250
# HELP nvidia_smi_power_draw_watts power.draw [W]
# TYPE nvidia_smi_power_draw_watts gauge
nvidia_smi_power_draw_watts{uuid="df6e7a7c-7314-46f8-abc4-b88b36dcf3aa"} 28.07
# HELP nvidia_smi_power_limit_watts power.limit [W]
# TYPE nvidia_smi_power_limit_watts gauge
nvidia_smi_power_limit_watts{uuid="df6e7a7c-7314-46f8-abc4-b88b36dcf3aa"} 250
# HELP nvidia_smi_power_management power.management
# TYPE nvidia_smi_power_management gauge
nvidia_smi_power_management{uuid="df6e7a7c-7314-46f8-abc4-b88b36dcf3aa"} 1
# HELP nvidia_smi_power_max_limit_watts power.max_limit [W]
# TYPE nvidia_smi_power_max_limit_watts gauge
nvidia_smi_power_max_limit_watts{uuid="df6e7a7c-7314-46f8-abc4-b88b36dcf3aa"} 350
# HELP nvidia_smi_power_min_limit_watts power.min_limit [W]
# TYPE nvidia_smi_power_min_limit_watts gauge
nvidia_smi_power_min_limit_watts{uuid="df6e7a7c-7314-46f8-abc4-b88b36dcf3aa"} 105
# HELP nvidia_smi_pstate pstate
# TYPE nvidia_smi_pstate gauge
nvidia_smi_pstate{uuid="df6e7a7c-7314-46f8-abc4-b88b36dcf3aa"} 8
# HELP nvidia_smi_temperature_gpu temperature.gpu
# TYPE nvidia_smi_temperature_gpu gauge
nvidia_smi_temperature_gpu{uuid="df6e7a7c-7314-46f8-abc4-b88b36dcf3aa"} 34
# HELP nvidia_smi_utilization_gpu_ratio utilization.gpu [%]
# TYPE nvidia_smi_utilization_gpu_ratio gauge
nvidia_smi_utilization_gpu_ratio{uuid="df6e7a7c-7314-46f8-abc4-b88b36dcf3aa"} 0
# HELP nvidia_smi_utilization_memory_ratio utilization.memory [%]
# TYPE nvidia_smi_utilization_memory_ratio gauge
nvidia_smi_utilization_memory_ratio{uuid="df6e7a7c-7314-46f8-abc4-b88b36dcf3aa"} 0
# HELP promhttp_metric_handler_requests_in_flight Current number of scrapes being served.
# TYPE promhttp_metric_handler_requests_in_flight gauge
promhttp_metric_handler_requests_in_flight 1
# HELP promhttp_metric_handler_requests_total Total number of scrapes by HTTP status code.
# TYPE promhttp_metric_handler_requests_total counter
promhttp_metric_handler_requests_total{code="200"} 0
promhttp_metric_handler_requests_total{code="500"} 0
promhttp_metric_handler_requests_total{code="503"} 0
Contributing
See CONTRIBUTING for details.


