178 Resources
Golang endpoint-monitoring Libraries
A simple, standalone, and lightWeight tool that can do health/status checking, written in Go.

EaseProbe EaseProbe is a simple, standalone, and lightWeight tool that can do health/status checking, written in Go. Table of Contents EaseProbe 1. Ov
A lib for monitoring runtime goroutine stack
Overview A lib for monitoring runtime goroutine stack. Such as wait for goroutines to exit, leak detection, etc. Features context.Context first design
Fast :zap: reverse proxy in front of any GraphQL server for caching, securing and monitoring.
Fast ⚡ reverse proxy in front of any GraphQL server for caching, securing and monitoring. Features 💾 Caching RFC7234 compliant HTTP Cache. Cache quer
IT Asset Fleet Remote Management and Monitoring (RMM) platform
ratd Remote Access Toolkit Daemon IT Asset Remote Management and Monitoring (RMM) platform How to use: You can't, just yet. Release Plan Release 0 Cre
Monitoring-go - A simple monitoring tool to sites of MOVA
Monitoring GO A simple monitoring tool to sites of MOVA How to use Clone Repo gi
Microservice responsible for the monitoring of active connections in RapidPro channels.
c-conn-watcher An application for watch active channel connections from specifc channels in Rapidpro and give metrics from this to serve for Prometheu
Qfy - Self-hosted implementation of Synthetics - Monitoring checks to validate your service availability
qfy Self-hosted implementation of Synthetics - Monitoring checks to validate you
This repo contains a sample app exposing a gRPC health endpoint to demo Kubernetes gRPC probes.
This repo contains a sample app exposing a health endpoint by implementing grpc_health_v1. Usecase is to demo the gRPC readiness and liveness probes introduced in Kubernetes 1.23.
Mauliasproxy - a simple room alias proxy that can respond to the federation alias query endpoint
Mauliasproxy - a simple room alias proxy that can respond to the federation alias query endpoint
Simple Golang tool for monitoring linux cpu, ram and disk usage.
Simple Golang tool for monitoring linux cpu, ram and disk usage.
Go-site-crawler - a simple application written in go that can fetch contentfrom a url endpoint
Go Site Crawler Go Site Crawler is a simple application written in go that can f
Portmantool - Port scanning and monitoring tool
portmantool Port scanning and monitoring tool Components runner while true do r
Monitoriamento-go - Program for monitoring websites in Golang
***Programa para monitoriamento de sites em Go lang. *** No "sitesaqui.txt" colo
Simple go endpoint with gorilla / mux routing, testing, dockerfile
Simple go endpoint with gorilla / mux routing, testing, dockerfile
It took me a while to figure out how I can use GraphQL with the ent ORM and serve the GraphQL endpoint via the Echo framework
Go + Graphql + Ent + Echo Boilerplate It took me a while to figure out how I can use GraphQL with the ent ORM and serve the GraphQL endpoint via the E
This is a tool that will proxy simple HTTPS requests to an external HTTP endpoint

AcmeShield A secured HTTP proxy that forwards requests from a remote service(Postman). This is a tool that will proxy simple HTTPS requests to an exte
Yaf - Yet another system fetch that is minimal and customizable
Yaf - Yet Another Fetch [Support] [Installation] [Usage] Brief Yet Another Fetch
Velociraptor - Endpoint visibility and collection tool.
Velociraptor - Endpoint visibility and collection tool. Velociraptor is a tool for collecting host based state information using The Velociraptor Quer
A wrapper for exposing a shared endpoint for Google Cloud Functions in go. API styled after Node.JS firebase-functions package.
firebase-fx A wrapper for Google Cloud Functions that simplifies the deployment of serverless applications. Meant to expose a similar API to the Fireb
Monitor - API endpoints for system monitoring
System monitor Golang API for accessing system stats, linux-only $ curl -s http:
Rekor-sidekick - Rekor transparency log monitoring and alerting
🔍 Rekor Sidekick Rekor Sidekick monitors a Rekor signature transparency log and
Passive DNS Capture/Monitoring Framework
Table of Contents DNS Monster Main features Installation Linux Container Build Manually Build Statically Windows FreeBSD and MacOS Architecture AIO In
Metrics go: CudgX indicator management tool, which integrates monitoring and data analysis indicator capabilities
Metrics-Go metrics-go 是cudgx指标打点工具,它集成了监控和数据分析指标能力。 数据流程 指标数据流程为: 用户代码调用打点 SDK指标
Nightingale - A Distributed and High-Performance Monitoring System. Prometheus enterprise edition

Introduction 💡 A Distributed and High-Performance Monitoring System. Prometheus
A fast and lightweight interactive terminal based UI application for tracking cryptocurrencies 🚀

cointop Coin tracking for hackers cointop is a fast and lightweight interactive terminal based UI application for tracking and monitoring cryptocurren
Alertmanager-cli is a cli writtin in golang to silence alerts in AlertManager
Alertmanager-cli is a cli writtin in golang to silence alerts in AlertManager
Otx - otx tool can scrap to find sensitive information and vulnerable endpoint urls.

otx Description This tool is base on AlienVault Open Threat Exchange (OTX)? and this tool can help you to extract all the urls endpoints which can be
Health-go - Web based app for health tracking and monitoring (Go port)
Health Web based app for health tracking and monitoring. Work in progress. Installation Clone the repository: git clone [email protected]:jonathantorr
Gogrok is a self hosted, easy to use alternative to ngrok. It uses SSH as a base protocol, using channels and existing functionality to tunnel requests to an endpoint.
gogrok A simple, easy to use ngrok alternative (self hosted!) The server and client can also be easily embedded into your applications, see the 'serve
metrics2.0 based, multi-tenant timeseries store for Graphite and friends.
Grafana Metrictank Introduction Grafana Metrictank is a multi-tenant timeseries platform that can be used as a backend or replacement for Graphite. It
A horizontally scalable, highly available, multi-tenant, long term Prometheus.
Cortex: horizontally scalable, highly available, multi-tenant, long term storage for Prometheus. Cortex provides horizontally scalable, highly availab
Distributed tracing using OpenTelemetry and ClickHouse
Distributed tracing backend using OpenTelemetry and ClickHouse Uptrace is a dist
Package bright-golang is a client for the Bright App energy monitoring API.
Go client library for the Bright API Package bright-golang is a client for the Bright App energy monitoring API. Not all the API endpoints are impleme
The Coherence command line interface (CLI) is a lightweight tool, in the tradition of tools such as kubectl
Coherence Command Line Interface (CLI) Contents Overview Why use the Coherence C
Making SLOs with Prometheus manageable, accessible, and easy to use for everyone!

Making SLOs with Prometheus manageable, accessible, and easy to use for everyone! Features Support for Kubernetes, Docker, and filesystem Alerting: Ge
⛑ Gatus - Automated service health dashboard
Gatus is a health dashboard that gives you the ability to monitor your services using HTTP, ICMP, TCP, and even DNS queries as well as evaluate the re
Instant Kubernetes-Native Application Observability

Pixie is an open source observability tool for Kubernetes applications. Use Pixie to view the high-level state of your cluster (service maps, cluster
Enterprise Network Flow Collector (IPFIX, sFlow, Netflow)

High-performance, scalable and reliable IPFIX, sFlow and Netflow collector (written in pure Golang). Features IPFIX RFC7011 collector sFLow v5 raw hea
Protoc plugin used to generate go-kit grpc code
protoc-gen-gokit-endpoint protoc plugin used to generate go-kit grpc code 安装 go
Provides a rest API that used to count how many times a certain repository of your github has been cloned.
traffic-clones-api An apiserver for https://shields.io/endpoint. Description Provides a rest API that used to count how many times a certain repositor
Protoc plugin used to generate go-kit grpc code
protoc-gen-gokit-endpoint protoc plugin used to generate go-kit grpc code 安装 go install github.com/wwbweibo/protoc-gen-gokit-endpoint/cmd/protoc-gen-g
Make Endpoint API using Golang, Mux Library, MySQL, and Redis
EndPoint API (Create and Read) I'm Using Golang, Mux Library, MySQL, and Redis Golang Documentation : https://go.dev/doc/ Golang Instalation : https:/
System agent. Reports server status via HTTP API
sys-agent System agent is a simple service reporting server status via HTTP GET request. usage $ sys-agent -l :8080 -v "root:/" -v "data:/mnt/data" Ap
Provide an upload endpoint that stores files on pinata and returns a json response with the uploaded file pinata url
Purpose Build a template repository to get to coding as quickly as possible, by starting from a common template which follows the guidelines here Feat
CPU usage percentage is the ratio of the total time the CPU was active, to the elapsed time of the clock on your wall.
Docker-Kubernetes-Container-CPU-Utilization Implementing CPU Load goroutine requires the user to call the goroutine from the main file. go CPULoadCalc
Kstone is an etcd management platform, providing cluster management, monitoring, backup, inspection, data migration, visual viewing of etcd data, and intelligent diagnosis.
Kstone 中文 Kstone is an etcd management platform, providing cluster management, monitoring, backup, inspection, data migration, visual viewing of etcd
PinGo is a standalone and feature-rich tool for common IP-based reachability checking tasks. Ping or Trace and Observe in real-time the statistics.
pingo As a network champion from designing and implementing to troubleshooting large scale networks - I know that is usually not easy for administrato
Enterprise Network Flow Collector (IPFIX, sFlow, Netflow)
High-performance, scalable and reliable IPFIX, sFlow and Netflow collector (written in pure Golang). Features IPFIX RFC7011 collector sFLow v5 raw hea
Fast, zero config web endpoint change monitor

web monitor fast, zero config web endpoint change monitor. for comparing responses, a selected list of http headers and the full response body is stor
Prometheus exporter for connext subgraphs
Subgraph monitoring exporter Prometheus exporter which provides metrics for monitoring multi subgraphs and rpc nodes by graphql request to graph-node
Monitoring stack app for golang
Monitoring Application This is a simple monitoring application taken from the following repositor: https://github.com/AnaisUrlichs/observe-argo-rollou
A realtime teenage driver behaviour monitoring system integrating OBII sensor, smart watch, smartphone, and Raspberry Pi, which examines over time novice teenage driving performance and risk
DriverMonitor A realtime teenage driver behaviour monitoring system integrating OBII sensor, smart watch, smartphone, and Raspberry Pi, which examines
Monitor & detect crashes in your Kubernetes(K8s) cluster

kwatch kwatch helps you monitor all changes in your Kubernetes(K8s) cluster, detects crashes in your running apps in realtime, and publishes notificat
Simple endpoint to create chat for specific application.
About Chat System Simple endpoint to create chat for specific application. Note This endpoints depend on chat-system repoistory, so you ought to run c
Open Source Software monitoring platform tools.
ByteOpen Open Source Software monitoring platform tools. Usage Clone the repo to your own go src path cd ~/go/src git clone https://code.byted.org/inf
A profiling tool to peek and profile the memory or cpu usage of a process

Peekprof Get the CPU and Memory usage of a single process, monitor it live, and extract it in CSV and HTML. Get the best out of your optimizations. Us
Hard Drive S.M.A.R.T Monitoring, Historical Trends & Real World Failure Thresholds
Hard Drive S.M.A.R.T Monitoring, Historical Trends & Real World Failure Thresholds
Server motherboard hardware monitoring
hardware-events This software helps with the monitoring of a server motherboard. The project started when I changed the FANs on a Supermicro motherboa
Create one endpoint with add user functionality
hubuc-task Create one endpoint with add user functionality
Monitoring service uses variables with golang
Monitoring service Setting up Monitoring service uses variables. If no variables are set, the default values listed below will be used: PORT=8000 SECR
Ethereum clients monitor

e7mon Tool for monitoring your Ethereum clients. Client-agnostic as it queries the standardized JSON-RPC APIs. Requires the following APIs to be expos
A simple CLI tool to help you manage your CPU
gocpu A simple cli tool to handle and watch your CPU. Usage Usage gocpu [subcommand] [flags] subcommand: watch - see the realtime cpu frequenc
Monitoring Go application inside docker container by InfluxDB, Telegraf, Grafana

REST API for TreatField app Docker compose for TIG and Golang simple app: https://github.com/tochytskyi/treatfield-api/blob/main/docker-compose.yml Gr
Shopping List webapp with Prometheus metrics endpoint
shopping-list Shopping List webapp with Prometheus metrics endpoint This is an example app with prometheus metrics integrated. This app runs on port 5
Serve endpoint metadata for client side load balancing
Servok Servok is a service that provides endpoint metadata for client side load balancing. See CONTRIBUTING.md for instructions on how to contribute a
Ansible-driven CI/CD and monitoring system
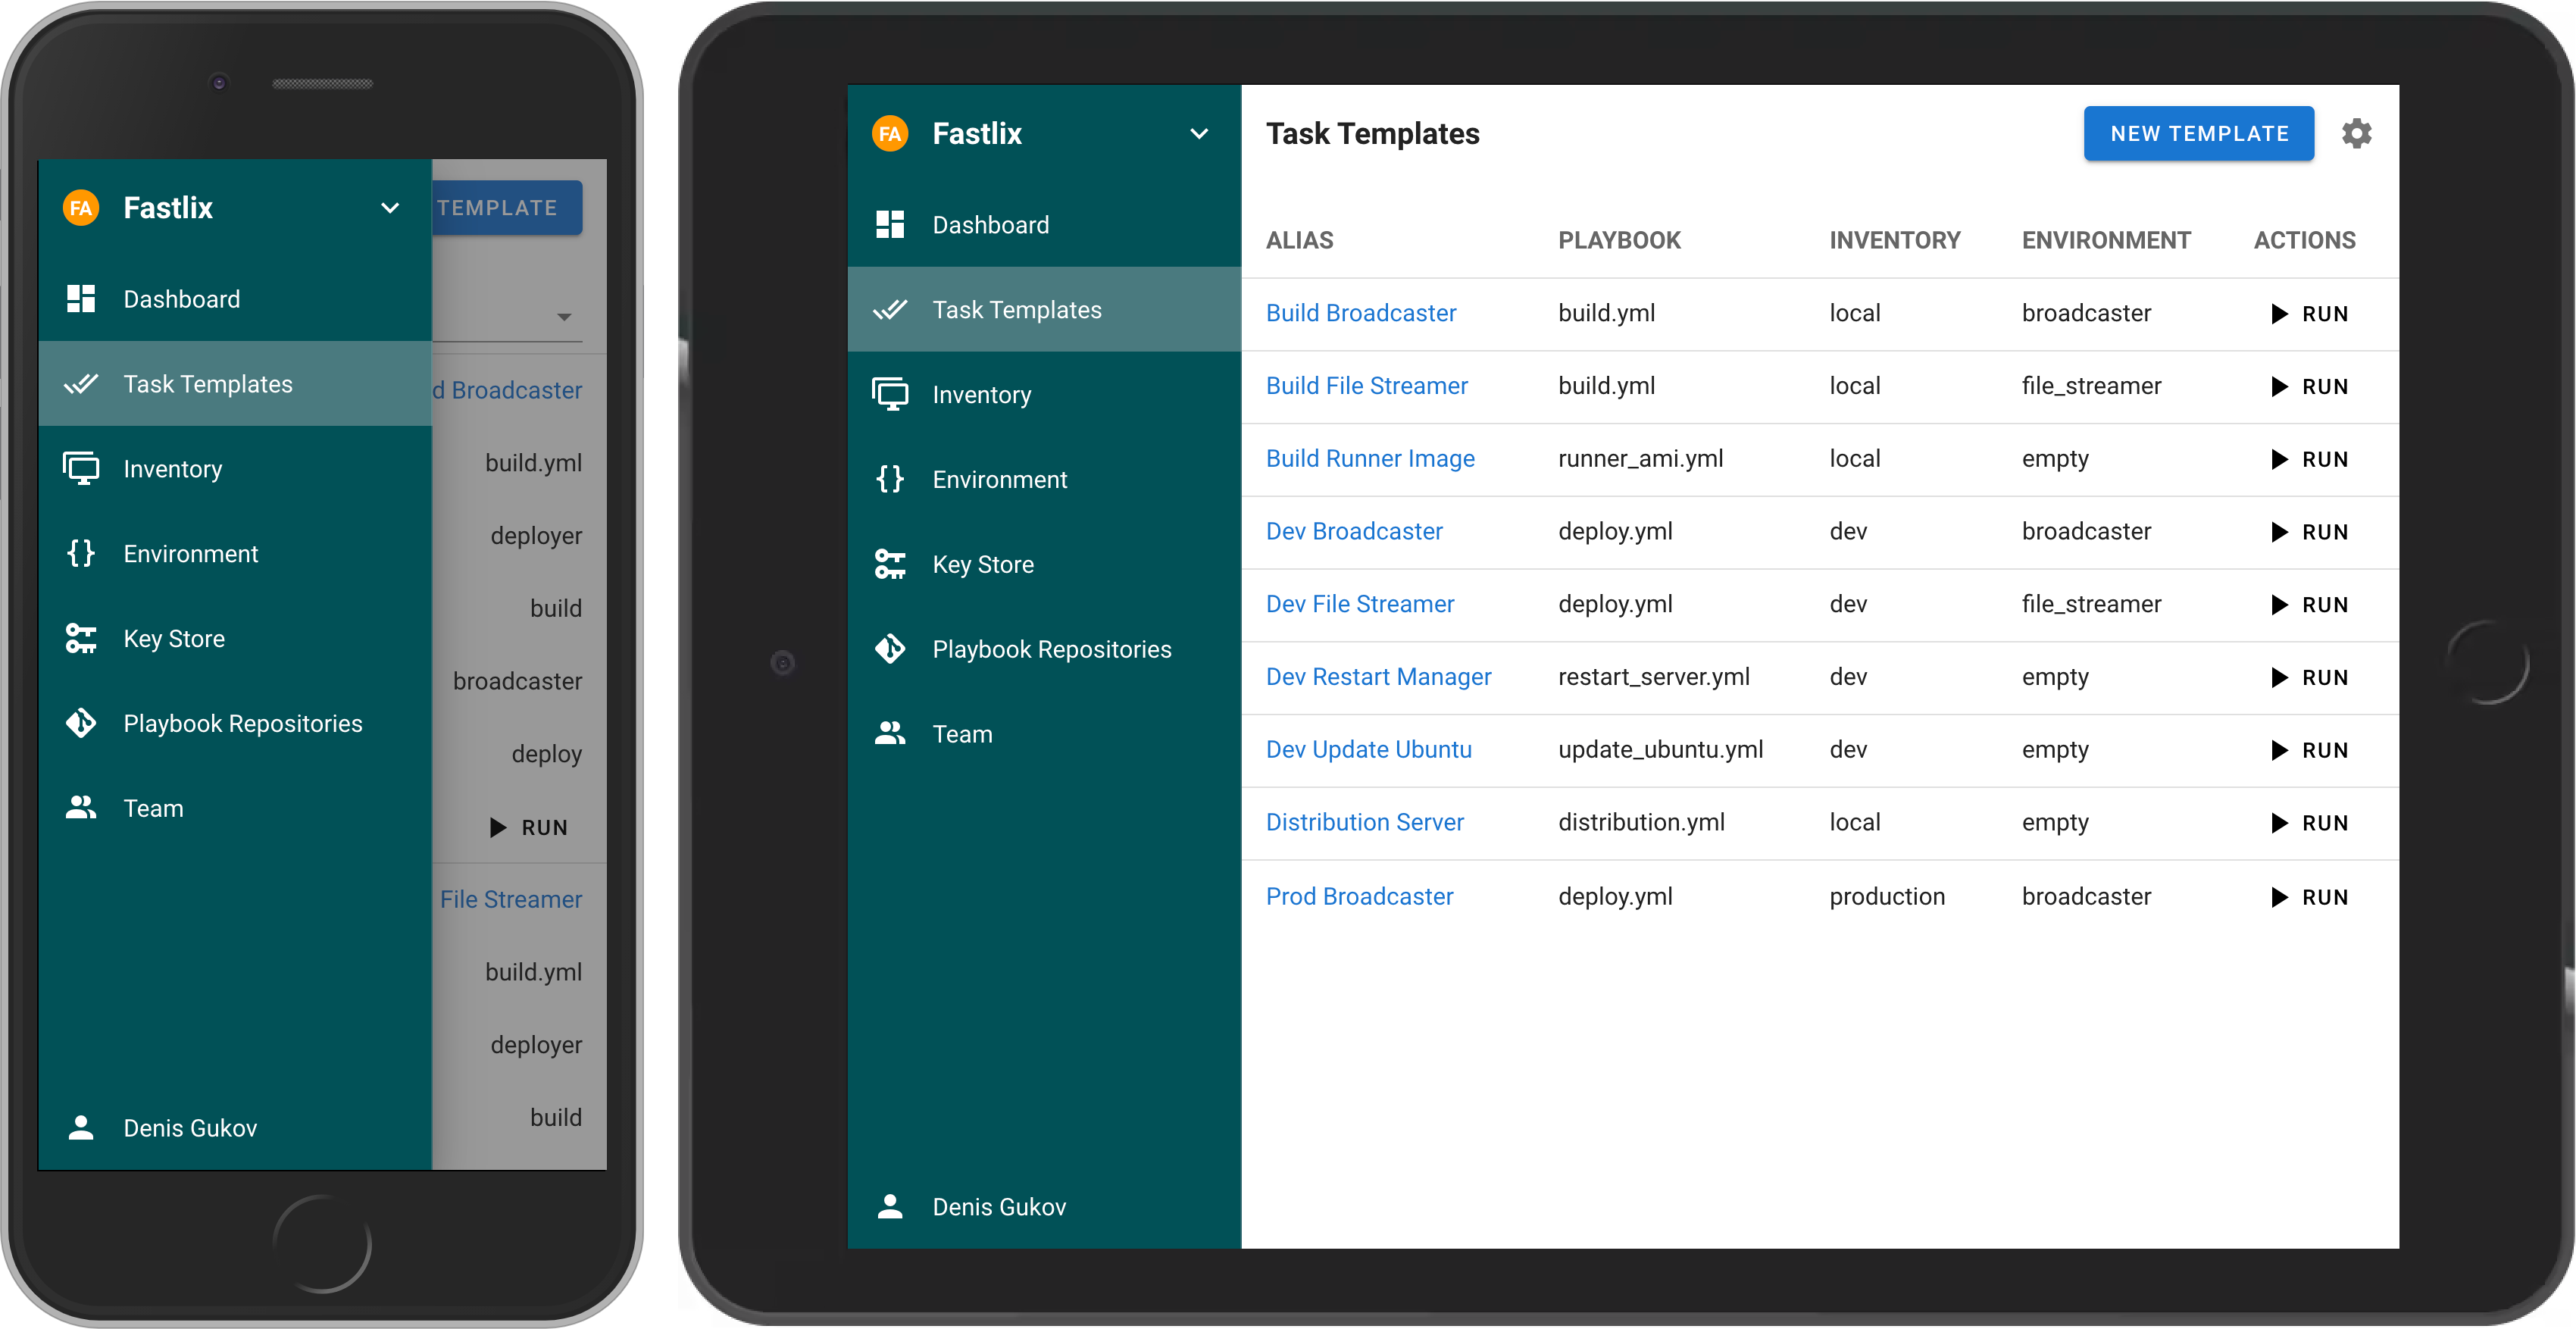
Ansible Semaphore Follow Semaphore on Twitter (AnsibleSem) and StackShare (ansible-semaphore). Ansible Semaphore is a modern UI for Ansible. It lets y
Next Generation Monitoring Server With Golang
Next Generation Monitoring Server Build make Arguments $ bin/ng-monitoring-server --help Usage of bin/ng-monitoring-server: --address string
Cloudprober is a monitoring software that makes it super-easy to monitor availability and performance of various components of your system.
Cloudprober is a monitoring software that makes it super-easy to monitor availability and performance of various components of your system. Cloudprobe
Schema-free, document-oriented streaming database that optimized for monitoring network traffic in real-time
Basenine Schema-free, document-oriented streaming database that optimized for monitoring network traffic in real-time. Featured Aspects Has the fastes
Metrics package helps to create ydb-go-sdk traces with monitoring internal state of driver
metrics metrics package helps to create ydb-go-sdk traces with monitoring internal state of driver Usage import ( "fmt" "sync/mutex" "time
Person is a simple CRUD application written in go which exposes API endpoint to create the person.
Person Person is a simple CRUD application written in go which exposes API endpoint to create the person. Installation Install docker in your local sy
A prometheus exporter for monitoring FIO nodeos nodes.

fio-prometheus-exporter This is a simple prometheus exporter for FIO nodeos nodes. It can connect to multiple nodes to display a few critical statisti
Tool for monitoring your Ethereum clients. Client-agnostic as it queries the standardized JSON-RPC APIs

e7mon Tool for monitoring your Ethereum clients. Client-agnostic as it queries the standardized JSON-RPC APIs. However, the execution client should be
🚨 Collection of Prometheus alerting rules
👋 Awesome Prometheus Alerts Most alerting rules are common to every Prometheus setup. We need a place to find them all. 🤘 🚨 📊 Collection available
⎈❏ Terminal and Web console for Kubernetes
Kubebox ⎈❏ Terminal and Web console for Kubernetes Features ✓ Configuration from kubeconfig files (KUBECONFIG environment variable or $HOME/.kube) ✓ S
A simple server which can be used as an RPC endpoint in popular Ethereum wallets.
RPC Endpoint This repository contains code for a simple server which can be used as an RPC endpoint in popular Ethereum wallets. The endpoint is https
Continuous profiling for analysis of CPU, memory usage over time, and down to the line number. Saving infrastructure cost, improving performance, and increasing reliability.

Continuous profiling for analysis of CPU, memory usage over time, and down to the line number. Saving infrastructure cost, improving performance, and increasing reliability.
Fleet - Open source device management, built on osquery.

Fleet - Open source device management, built on osquery.
rtsp to webrtc proxy with websocket signaling, currently limited to single h264 stream per endpoint
rtp-to-webrtc rtp-to-webrtc demonstrates how to consume a RTP stream video UDP, and then send to a WebRTC client. With this example we have pre-made G
A simple tool who pulls data from Online.net API and parse them to a Prometheus format
Dedibox backup monitoring A simple tool who reads API from Online.net and parse them into a Prometheus-compatible format. Conceived to be lightweight,
Detecctor is a ⚡ fast, fully customizable 💗 monitoring platform. It uses Telegram as a notification 📥 service
Detecctor is a ⚡ fast, fully customizable 💗 monitoring platform. It uses Telegram as a notification 📥 service. The main components are a TCP server, MongoDB and multiple clients.
SigNoz helps developers monitor their applications & troubleshoot problems, an open-source alternative to DataDog, NewRelic, etc. 🔥 🖥. 👉 Open source Application Performance Monitoring (APM) & Observability tool
Monitor your applications and troubleshoot problems in your deployed applications, an open-source alternative to DataDog, New Relic, etc. Documentatio
mtail - extract internal monitoring data from application logs for collection into a timeseries database
mtail - extract internal monitoring data from application logs for collection into a timeseries database mtail is a tool for extracting metrics from a
Alert dashboard for Prometheus Alertmanager

karma Alert dashboard for Prometheus Alertmanager. Alertmanager =0.19.0 is required as older versions might not show all receivers in karma, see issu
Monitoring and automation for Open Source email servers, starting with Postfix.
Welcome to Lightmeter Control Center, the Open Source mailops monitoring application.
A proxy to add `/federate` to Thanos monitoring
Thanos Federate Proxy A proxy to convert /federate queries to /v1/api/query and respond in open metrics format. The most common use case for this prox
kubetnl tunnels TCP connections from within a Kubernetes cluster to a cluster-external endpoint, e.g. to your local machine. (the perfect complement to kubectl port-forward)
kubetnl kubetnl (kube tunnel) is a command line utility to tunnel TCP connections from within a Kubernetes to a cluster-external endpoint, e.g. to you
Command line monitoring for goroutines
grmon Command line monitoring for goroutines Install go get -u github.com/bcicen/grmon Usage Simply import and call grmon.Start() somewhere in your co
A proxy that authorizes and enforces a given label in a given PromQL query
prom-authzed-proxy prom-authzed-proxy is a proxy for Prometheus that authorizes the request's Bearer Token with Authzed and enforces a label in a Prom
checkah is an agentless SSH system monitoring and alerting tool.
CHECKAH checkah is an agentless SSH system monitoring and alerting tool. Features: agentless check over SSH (password, keyfile, agent) config file bas
Pokes users on Slack about outstanding risks found by Crowdstrike Spotlight or vmware Workspace ONE so they can secure their own endpoint.

🤖 security-slacker Pokes users on Slack about outstanding risks found by Crowdstrike Spotlight or vmware Workspace ONE so they can secure their own e
Prometheus metrics for Go database/sql via VictoriaMetrics/metrics
sqlmetrics Prometheus metrics for Go database/sql via VictoriaMetrics/metrics Features Simple API. Easy to integrate. Install Go version 1.16+ go get
A tool for visualization and monitoring Redis cluster realtime

Redat is a tool for visualize Redis-cluster on terminal Features: Visualize master-replicas relations in the Redis cluster Monitor with metrics: memor
gosivy - Real-time visualization tool for Go process metrics

Gosivy tracks Go process's metrics and plot their evolution over time right into your terminal, no matter where it's running on. It helps you understand how your application consumes the resources.
Nvidia GPU exporter for prometheus using nvidia-smi binary
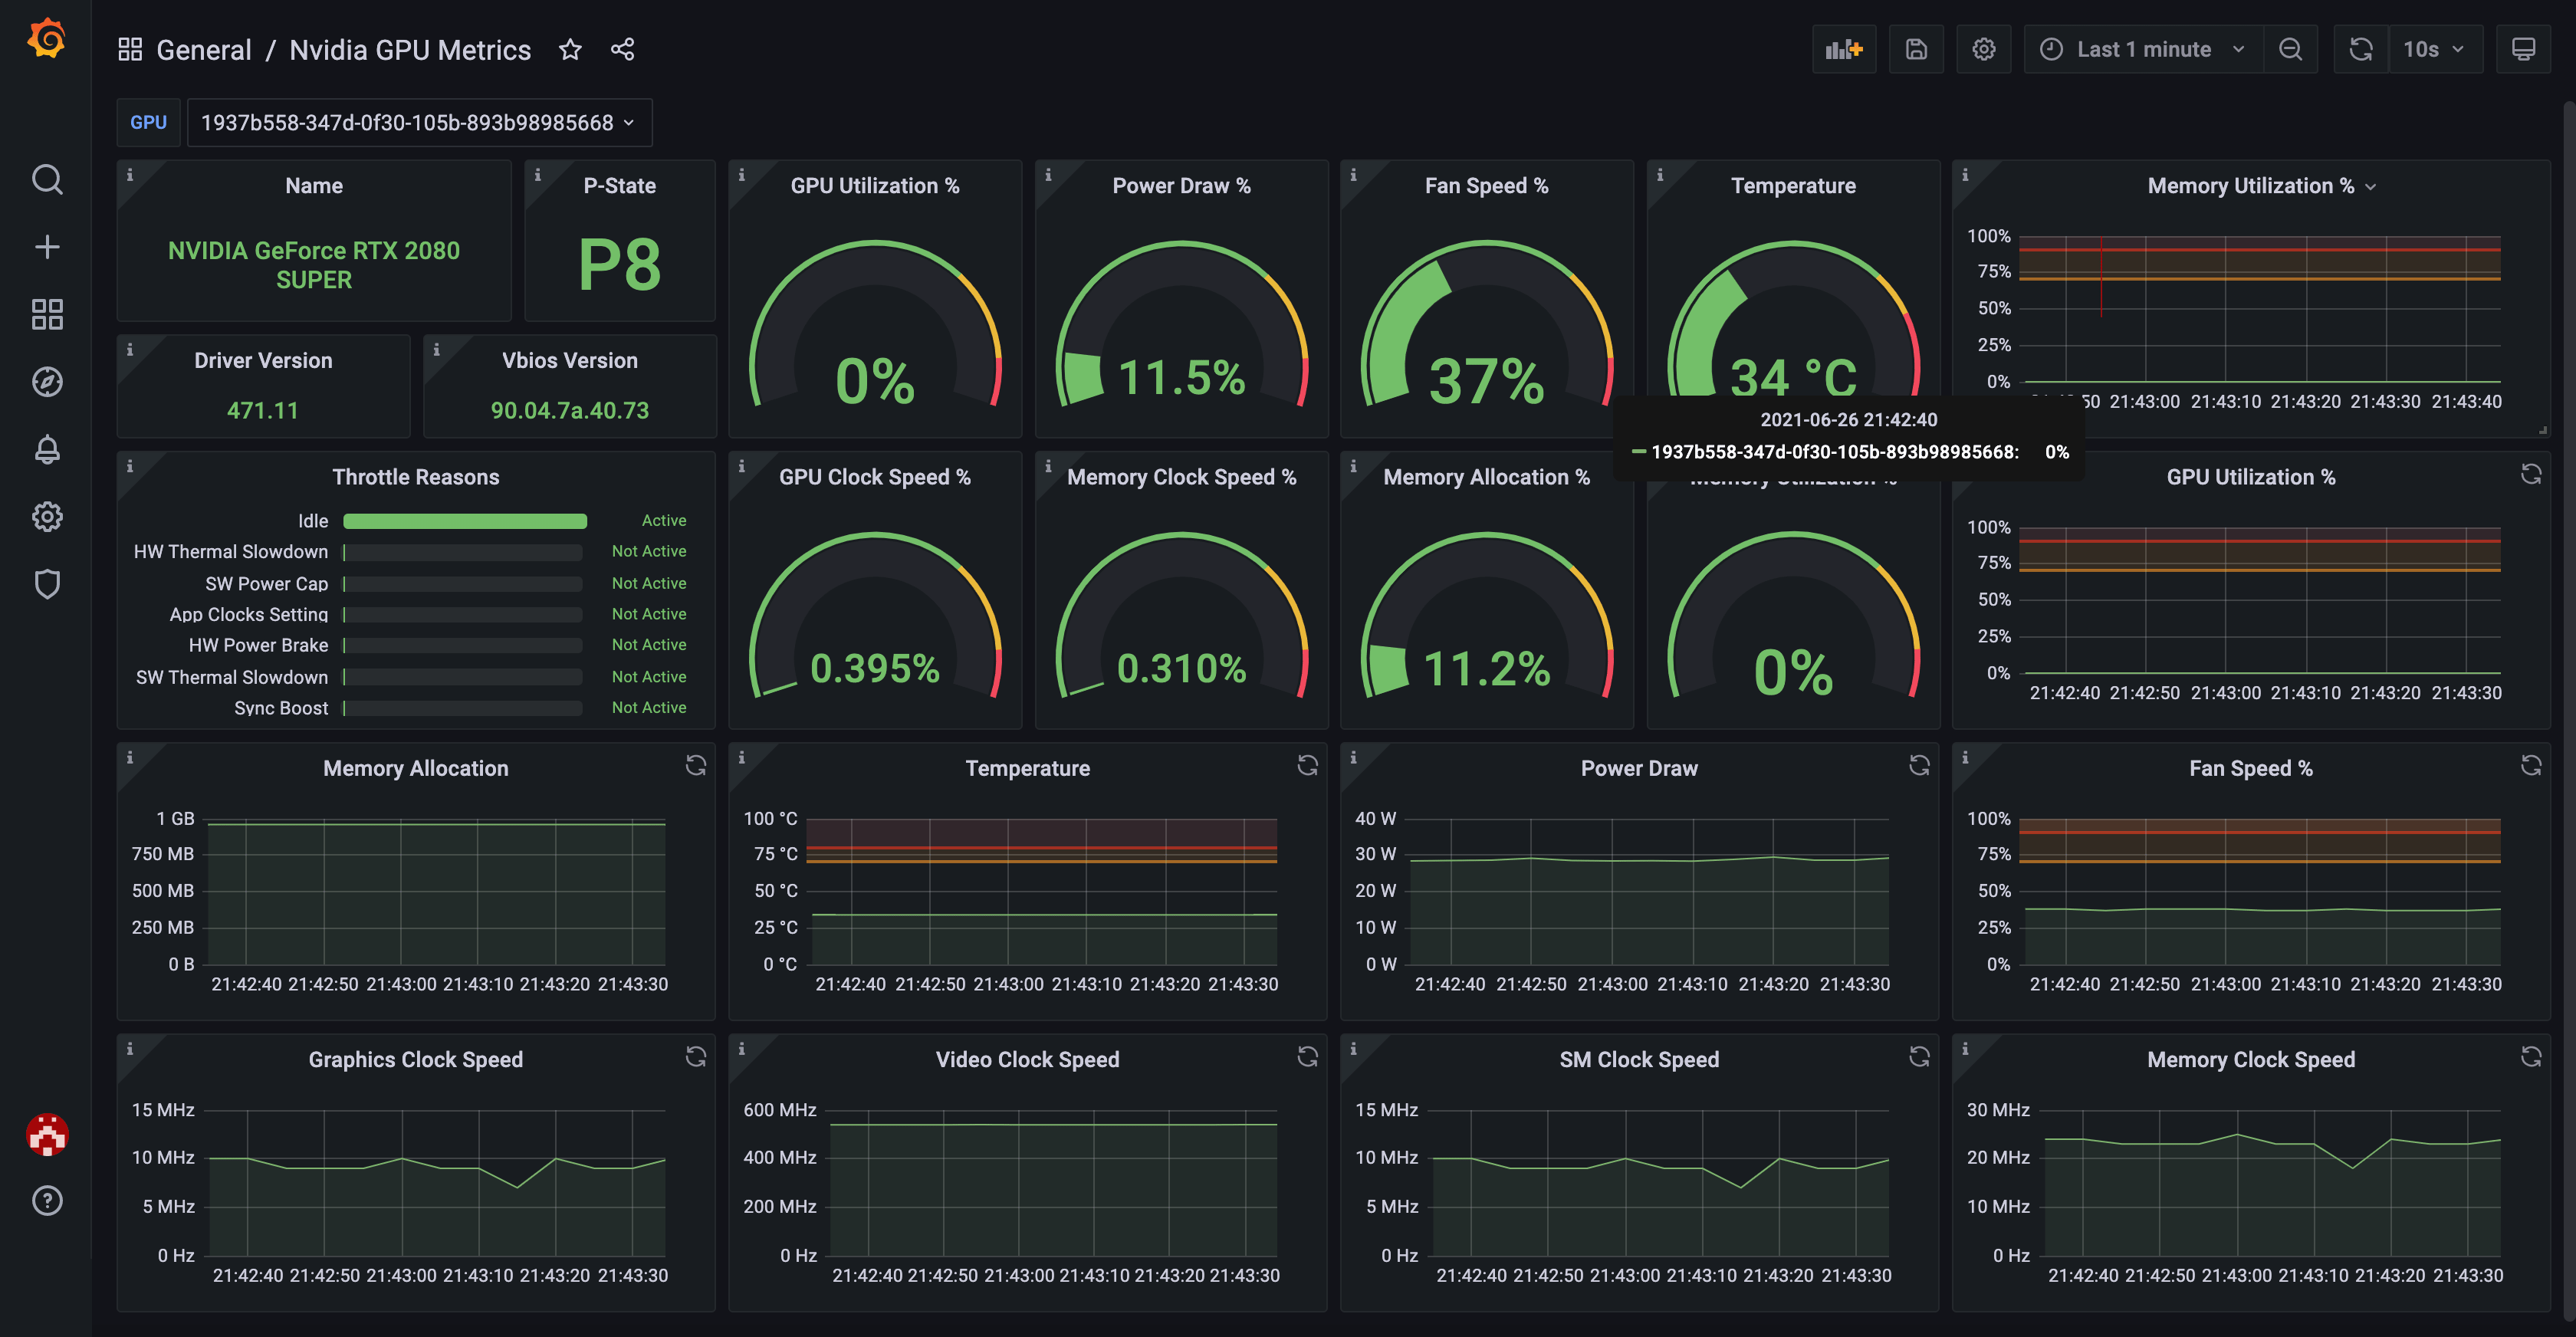
nvidia_gpu_exporter Nvidia GPU exporter for prometheus, using nvidia-smi binary to gather metrics. Introduction There are many Nvidia GPU exporters ou
Mortar is a GO framework/library for building gRPC (and REST) web services.

Mortar Mortar is a GO framework/library for building gRPC (and REST) web services. Mortar has out-of-the-box support for configuration, application me
TCPProbe is a modern TCP tool and service for network performance observability.

TCPProbe is a modern TCP tool and service for network performance observability. It exposes information about socket’s underlying TCP session, TLS and HTTP (more than 60 metrics). you can run it through command line or as a service. the request is highly customizable and you can integrate it with your application through gRPC. it runs in a Kubernetes cluster as cloud native application and by adding annotations on pods allow a fine control of the probing process.
gosivy - Another visualization tool for Go process metrics
gosivy Another visualization tool for Go process metrics. Gosivy tracks Go process's metrics and plot their evolution over time right into your termin
Tool for monitoring network devices (mainly using SNMP) - monitoring check plugin
Thola Description A tool for monitoring network devices written in Go. It features a check mode which complies with the monitoring plugins development
Lux is a command-line interface for controlling and monitoring Govee lighting strips built in Go.
What is Lux? Lux is a command-line interface for controlling and monitoring Govee lighting strips built in Go. Lux provides it's users with the abilit