205 Resources
Golang metrics-gathering-daemon Libraries
MIDI tunneling through BGP, for times when you want to broadcast your music instead of your IP packets.
BGPiano MIDI tunneling through BGP, for times when you want to broadcast your music instead of your IP packets. Usage bgpiano-send and bgpiano-recv Po
A GitHub CLI extension that provides summary pull request metrics.
gh-metrics A gh extension that provides summary pull request metrics. Usage Metric definitions Influences Usage To install the extension use: $ gh ext
Lightweight KubeVela that runs as Daemon in single node with high availability.

VelaD Lightweight KubeVela that runs as Daemon in single node with k3s English | 简体中文 Introduction VelaD helps to set up KubeVela in one step. With th
Kepler (Kubernetes-based Efficient Power Level Exporter) uses eBPF to probe energy related system stats and exports as Prometheus metrics

kepler Kepler (Kubernetes Efficient Power Level Exporter) uses eBPF to probe energy related system stats and exports as Prometheus metrics Architectur
Metrics collector and ebpf-based profiler for C, C++, Golang, and Rust
Apache SkyWalking Rover SkyWalking Rover: Metrics collector and ebpf-based profiler for C, C++, Golang, and Rust. Documentation Official documentation
Grafana Mimir provides horizontally scalable, highly available, multi-tenant, long-term storage for Prometheus.
Grafana Mimir Grafana Mimir is an open source software project that provides a scalable long-term storage for Prometheus. Some of the core strengths o
CoreRAD is an extensible and observable IPv6 Neighbor Discovery Protocol router advertisement daemon. Apache 2.0 Licensed.
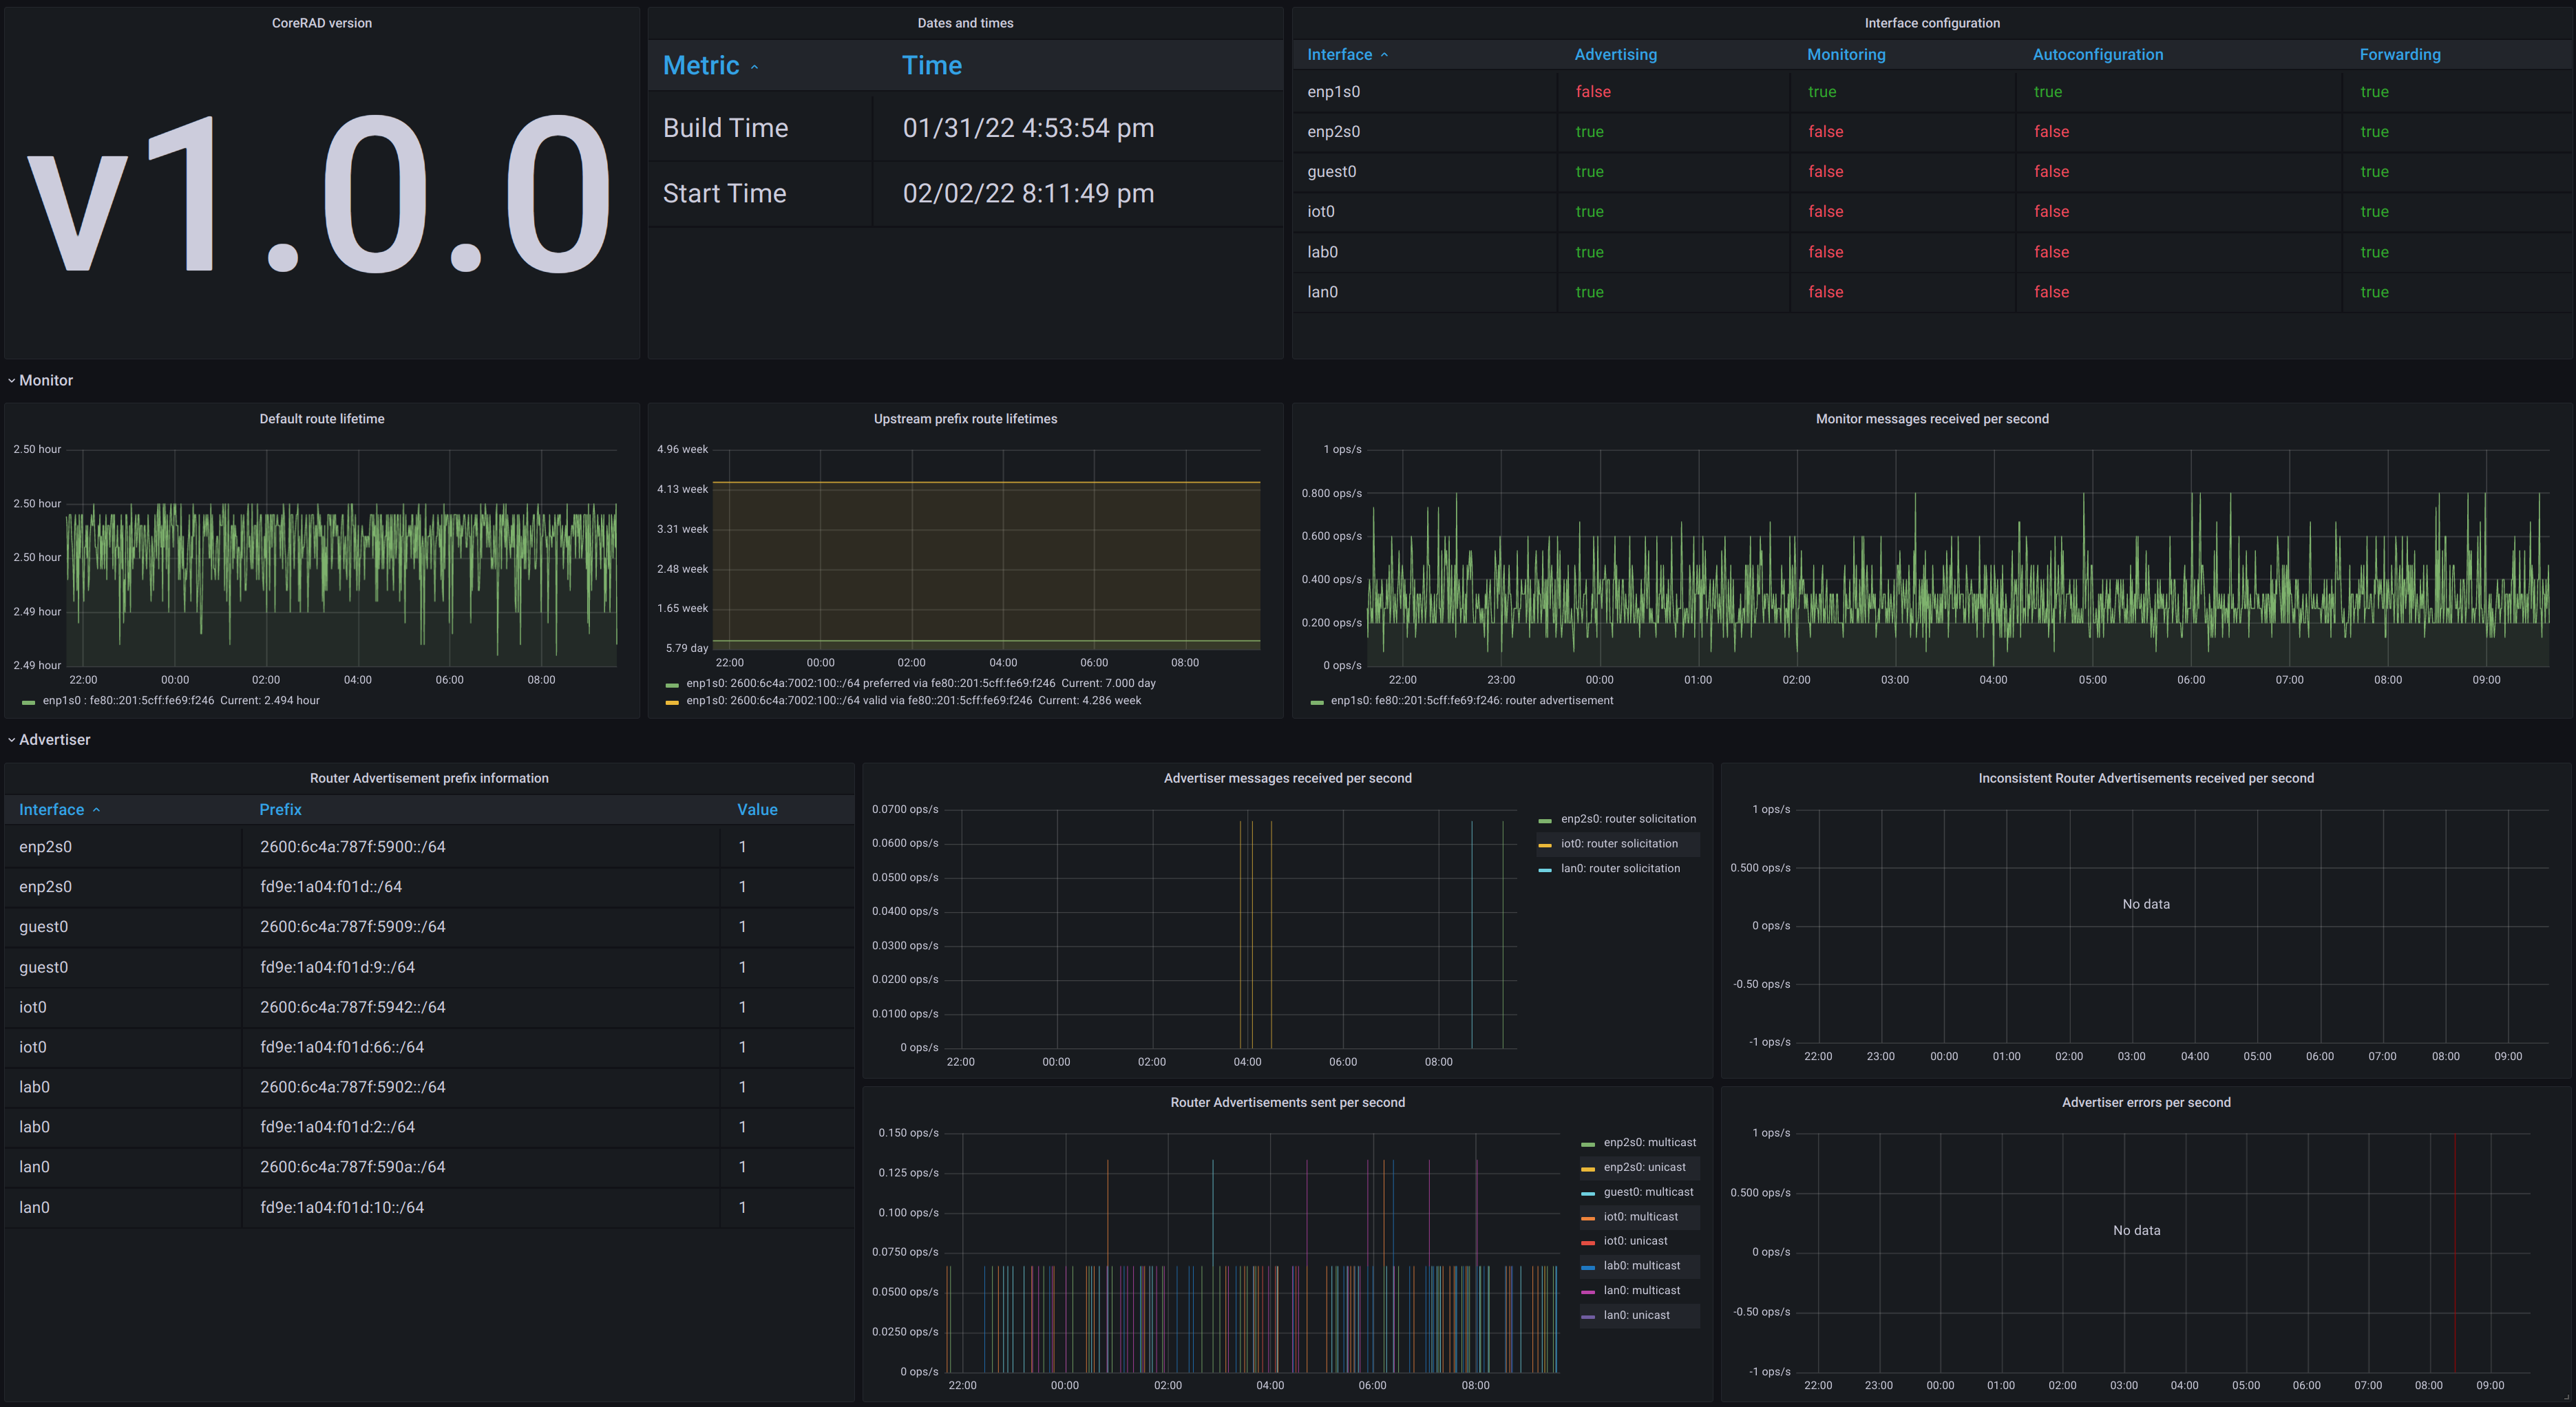
CoreRAD CoreRAD is an extensible and observable IPv6 Neighbor Discovery Protocol router advertisement daemon. Apache 2.0 Licensed. To get started with
A Prometheus exporter for Ethereum Execution & Consensus clients
🦄 Ethereum Metrics Exporter 🦄 A Prometheus metrics exporter for Ethereum execution & consensus nodes Ethereum client implementations expose extensiv
Wau helps you find apps where target email is registered.
Where are you ? 🧐 wau helps you find apps where target email is registered. wau takes less than 2 seconds! wau can be executed through a Command Line
CetusGuard is a tool that allows to protect the Docker daemon socket by filtering the calls to its API endpoints.
CetusGuard CetusGuard is a tool that allows to protect the Docker daemon socket by filtering the calls to its API endpoints. Some highlights: It is wr
nerdctl daemon (Docker API)

nerdctld This is a daemon offering a nerdctl.sock endpoint. It can be used with DOCKER_HOST=unix://nerdctl.sock. Normally the nerdctl tool is a CLI-on
Openbazaar-go - OpenBazaar Server Daemon in Go
openbazaar-go OpenBazaar Server Daemon in Go This repository contains the OpenBa
SMART information of local storage devices as Prometheus metrics
hpessa-exporter Overview Openshift's hpessa-exporter allows users to export SMART information of local storage devices as Prometheus metrics, by using
Telegraf - An agent for collecting, processing, aggregating, and writing metrics
Telegraf Telegraf is an agent for collecting, processing, aggregating, and writi
Github exporter for Prometheus metrics. Written in Go, with love ❤️
Github exporter for Prometheus This is a Github exporter for Prometheus metrics exposed by Github API. Written in Go with pluggable metrics collectors
This is a POC for a Falco Plugin allowing to gather events from a locale docker daemon.
Docker Events Plugin This is a POC for a Falco Plugin allowing to gather events from a locale docker daemon. ⚠️ This is a POC, don't use in Production
Fast golang web crawler for gathering URLs and JavaSript file locations.
Fast golang web crawler for gathering URLs and JavaSript file locations. This is basically a simple implementation of the awesome Gocolly library.
Exporter your cypress.io dashboard into prometheus Metrics
Cypress.io dashboard Prometheus exporter Prometheus exporter for a project from Cypress.io dashboards, giving the ability to alert, make special opera
Simple Golang tool for monitoring linux cpu, ram and disk usage.
Simple Golang tool for monitoring linux cpu, ram and disk usage.
The wazuh-integratord is a daemon that allows Wazuh to connect to external APIs and alerting tools such as Slack, VirusTotal and PagerDuty.
The wazuh-integratord is a daemon that allows Wazuh to connect to external APIs and alerting tools such as Slack, VirusTotal and PagerDuty.
Wrapper for Lightning Network Daemon (lnd). It provides separate accounts with minimum trust for end users.
LndHub.go Wrapper for Lightning Network Daemon (lnd). It provides separate accounts with minimum trust for end users. LndHub compatible API implemente
Otelsql - OpenTelemetry SQL database driver wrapper for Go

OpenTelemetry SQL database driver wrapper for Go Add a OpenTelemetry wrapper to
Read metrics from a Message Queue in Json format and expose them in a Prometheus compatible format
mq2prom Read metrics from a Message Queue in Json format and expose them in a Prometheus compatible format. Currently only works for MQTT compatible M
Flowlogs2metrics - Transform flow logs into metrics

Overview Flow-Logs to Metrics (a.k.a. FL2M) is an observability tool that consum
Openshift's hpessa-exporter allows users to export SMART information of local storage devices as Prometheus metrics, by using HPE Smart Storage Administrator tool
hpessa-exporter Overview Openshift's hpessa-exporter allows users to export SMART information of local storage devices as Prometheus metrics, by using
This library provides a metrics package which can be used to instrument code, expose application metrics, and profile runtime performance in a flexible manner.
This library provides a metrics package which can be used to instrument code, expose application metrics, and profile runtime performance in a flexible manner.
Traefik - Traefik with zitifed prometheus metrics
Traefik (pronounced traffic) is a modern HTTP reverse proxy and load balancer th
A daemon to make your keyboard backlight smart.
keyboard-backlight-daemon A daemon to make your keyboard backlight smart. Features Light up keyboard backlight based on user interaction (keyboard, mo
WIP! Important metrics for SWE teams
swe-dashboard Software Engineer Metrics Configuration scm-gitlab-baseurl scm-gitlab-token victoriametrics-importurl check-interval Docker Build docker
The metrics-agent collects allocation metrics from a Kubernetes cluster system and sends the metrics to cloudability
metrics-agent The metrics-agent collects allocation metrics from a Kubernetes cluster system and sends the metrics to cloudability to help you gain vi
Sensu-go-postgres-metrics - The sensu-go-postgres-metrics is a sensu check that collects PostgreSQL metrics
sensu-go-postgres-metrics Table of Contents Overview Known issues Usage examples
A proof-of-concept project that makes accessible buildkitd daemon from macOS
buildkit-machine buildkit-machine allows you to make buildkitd daemon accessible in your macOS environment. To do so, it uses lima, which is a Linux s
Client to import measurements to timestream databases.
Timestream DB Client Client to import measurements to timestream databases. Supported Databases/Services AWS Timestream AWS Timestream Run NewTimestre
Flash-metrics - Flash Metrics Storage With Golang
Flash Metrics Storage bootstrap: $ echo -e "max-index-length = 12288" tidb.con
Nutrition-overengineering - Application to calc healthcare and nutrition metrics, but using the most over engineered as possible
nutrition-overengineering Application to calc healthcare and nutrition metrics,
Metrics go: CudgX indicator management tool, which integrates monitoring and data analysis indicator capabilities
Metrics-Go metrics-go 是cudgx指标打点工具,它集成了监控和数据分析指标能力。 数据流程 指标数据流程为: 用户代码调用打点 SDK指标
Json-log-exporter - A Nginx log parser exporter for prometheus metrics
json-log-exporter A Nginx log parser exporter for prometheus metrics. Installati
Metric - Minimal metrics for Go (counter/gauge/histogram)

metric Package provides simple uniform interface for metrics such as counters, gauges and histograms. It keeps track of metrics in runtime and can be
Cole - Cole can use his sixth sense to give you metrics about your Grafana dashboards
Cole Cole can use his sixth sense to give you metrics about your Grafana dashboa
Mqexporter - Prometheus exporter for IBM MQ
MQ metrics for Prometheus Prometheus exporter for IBM MQ. License The repository
AutoK3s GEO collects metrics about locates remote IP-address and exposes metrics to InfluxDB.
AutoK3s GEO AutoK3s GEO collects metrics about locates remote IP-address and exposes metrics to InfluxDB. Thanks to https://freegeoip.live/ which prov
Calculate cyclomatic complexities of functions in Go source code.
gocyclo Gocyclo calculates cyclomatic complexities of functions in Go source code. Cyclomatic complexity is a code quality metric which can be used to
A toy project to play music (aha, Nose in fact) through Prometheus metrics
tiplay A toy project to play music (aha, mostly Noise in fact) through Prometheu
Simple application to calc healthcare and nutrition metrics
Nutritional Calculator Application Simple project do calculate healthcare metric
Vulcan extends Prometheus adding horizontal scalability and long-term storage
Warning: This project is currently not maintained, and there is no plan to do so ATM. Vulcan Vulcan extends Prometheus adding horizontal scalability a
metrics2.0 based, multi-tenant timeseries store for Graphite and friends.
Grafana Metrictank Introduction Grafana Metrictank is a multi-tenant timeseries platform that can be used as a backend or replacement for Graphite. It
M3 monorepo - Distributed TSDB, Aggregator and Query Engine, Prometheus Sidecar, Graphite Compatible, Metrics Platform
M3 Distributed TSDB and Query Engine, Prometheus Sidecar, Metrics Aggregator, and more such as Graphite storage and query engine. Table of Contents Mo
autobd is an automated, networked and containerized backup solution
![autobd] (logo.png?raw=true "autobd") Backing you up since whenever... What is it? Autobd is an automatic backup daemon. What is that? A daemon (deri
A standard library for microservices.

PACE Bricks Opinionated microservice kit to help developers to build microservices with go. Opinions A pace/bricks microservice is: built as a docker
Go starter project with Gin, Viper, postgres , redis, zap, prometheus metrics etc setup
Go REST Service Starter/Boilerplate Easily extendible REST API Service boilerplate aiming to follow idiomatic go and best practice. Any feedback and p
Observe host metrics collector Written in Go
Observe Host Metrics Collector Experimental collector and forwarder of host metr
Golang JSON RPC client to talk with Electrum server
Electrum JSON RPC Client Note: The library does not have implementations of all Electrum RPC resources[WIP]. PRs for new resources and endpoints are w
Reboot a machine without interrupting ongoing work
Smart Reboot What? Smart Reboot is a daemon(smartrebootd) and CLI(smartreboot) t
Automatically persists all the logs of your Go application inside RethinkDB.
go-rethinklogger go-rethinklogger persists and bundles all your logs from stdio and stderr to RethinkDB. • Can be used to monitor logs and analytics o
Full Monero RPC client(Wallet AND Daemon) written in go
Monero RPC Client in Go Full Monero RPC client(Wallet AND Daemon) written in go Version Client was written per docs on getmonero.org. Last update on d
NDP Proxy + Responder daemon
PNDPD - NDP Responder + Proxy Features Efficiently process incoming packets using bpf (which runs in the kernel) Respond to all NDP solicitations on a
Prometheus remote write proxy that adds Cortex tenant ID based on metric labels
cortex-tenant Prometheus remote write proxy which marks timeseries with a Cortex tenant ID based on labels. Architecture Overview Cortex tenants (sepa
Bastionzeros Agent and Daemon!
Bzero Bastionzero Bastionzero is a simple to use zero trust access SaaS for dynamic cloud environments. Bastionzero is the most secure way to lock dow
DNS synchronization daemon for the AIRE project.
dns-sync Database structure: { "name": "example-host.example.com", "content": "127.1.33.7" } ENV parameters: DEBUG: true|false DNS_FILTER: Reg
Making SLOs with Prometheus manageable, accessible, and easy to use for everyone!

Making SLOs with Prometheus manageable, accessible, and easy to use for everyone! Features Support for Kubernetes, Docker, and filesystem Alerting: Ge
Golang packages for writing small daemons and servers.
gone Golang packages for writing small daemons and servers. This is not strictly a "framework". The individual packages do not really depend on each o
An aggregator for personal metrics, and an extensible analysis engine

Heedy A repository for your personal data, and an extensible analysis engine. There already exist many apps and fitness trackers that gather and attem
Instant Kubernetes-Native Application Observability

Pixie is an open source observability tool for Kubernetes applications. Use Pixie to view the high-level state of your cluster (service maps, cluster
Monitors the expiry time of tls certificates and exports prometheus metrics
Certificate Monitor Monitors the expiry time of tls certificates and exports prometheus metrics. Target domains can be automatically discovered via in
Creates Prometheus Metrics for PolicyReports and ClusterPolicyReports.
Creates Prometheus Metrics for PolicyReports and ClusterPolicyReports. Ships with an optional Web UI and can send new Results to different Clients like Loki and Elasticsearch. Provides a optional Monitoring Subchart with a ServiceMonitor and Grafana Dashboards for the Prometheus Operator.
A Prometheus exporter for a Browserless instance.
Prometheus Browserless Exporter This is an exporter that exposes Browserless metrics for Prometheus. Browserless exposes some Prometheus metrics alrea
Capture sensor data from Xiaomi thermometers (via BLE) and expose it as prometheus metrics
sensor-probe Sensor Probe is a small utility that reads advertisement data sent by the Xiaomi Thermometer LYWSD03MMC via Bluetooth LE and expose them
⭕ A *nix cross-platform (OS agnostic) supervisor
⭕ immortal A *nix cross-platform (OS agnostic) supervisor https://immortal.run/ Linux precompiled binaries run on behalf other system user If services
Namecoin calendar notification daemon (ICS, CalDAV)
nccald nccald is a simple daemon to provide calendar notifications for Namecoin name expirations. The daemon periodically queries a Namecoin Core inst
Vale-compatible implementations of many popular "readability" metrics.
Readability This repository contains a Vale-compatible implementation of many popular "readability" metrics. Getting Started ❗ Readability requires Va
cluster-api-state-metrics (CASM) is a service that listens to the Kubernetes API server and generates metrics about the state of custom resource objects related of Kubernetes Cluster API.
Overview cluster-api-state-metrics (CASM) is a service that listens to the Kubernetes API server and generates metrics about the state of custom resou
gofrrsockets is a client library used to interact with FRR's daemon UNIX sockets
gofrrsockets gofrrsockets is a client library that can be used to send commands to FRR's daemon UNIX sockets. The library provides a safer (forking cm
LLS-Exporter exports fuel level sensor data (rs-485 lls protocol) as prometheus metrics
LLS Exporter LLS Exporter reads rs485/rs232 data from serial port, decodes lls protocol and exports fuel level sensor data as prometheus metrics. Lice
A Go metrics interface with fast buffered metrics and third party reporters
✔️ tally Fast, buffered, hierarchical stats collection in Go. Installation go get -u github.com/uber-go/tally Abstract Tally provides a common interfa
Telemetry interfaces for logs and metrics allowing complete decoupling of instrumentation implementations.
Telemetry This package provides a set of Telemetry interfaces allowing you to completely decouple your libraries and packages from Logging and Metrics
A daemon that has the purpose of installing and removing policies as they are laid in a specific directory
selinuxd This a daemon that has the purpose of installing and removing policies as they are laid in a specific directory. This directory is /etc/selin
Export Prometheus metrics from journald events using Prometheus Go client library
journald parser and Prometheus exporter Export Prometheus metrics from journald events using Prometheus Go client library. For demonstration purposes,
Advanced information gathering & OSINT framework for phone numbers
PhoneInfoga is one of the most advanced tools to scan international phone numbers using only free resources. It allows you to first gather standard information such as country, area, carrier and line type on any international phone number.
A prometheus exporter which reports metrics about your Gmail inbox.
prometheus-gmail-exporter-go A prometheus exporter for gmail. Heavily inspired by https://github.com/jamesread/prometheus-gmail-exporter, but written
Golang daemon to update i3 workspace icons
i3-icons-daemon Is a lightweight golang daemon service that updates your i3 workspace based on the programs that are running in your workspace's windo
Aidos Kuneen (v2 network) daemon program that is controlled through the command line and remotely via RPC calls
adk-daemon: aidosd.v2 aidosd (v2) is a deamon which acts as bitcoind for adk. This version has been built specifically for network mesh version 2+ For
Prometheus metrics from Deco M4
Prometheus Deco Exporter Provider prometheus metrics from Deco M4. Usage Set the environment variables DECO_EXPORTER_ADDR to the address of your main
Helper sidecar for exposing Prometheus metrics as service
metrics-server-go Helper sidecar service for exposing prometheus metrics. Application expose endpoints to update defined metrics. Whats inside? The se
mackerel-agent is an agent program to post your hosts' metrics to mackerel.io.

mackerel-agent mackerel-agent is a client software for Mackerel. Mackerel is an online visualization and monitoring service for servers. Once mackerel
Go http.RoundTripper that emits open telemetry metrics. This helps you easily get metrics for all external APIs you interact with.
go-otelroundtripper This package provides an easy way to collect http related metrics (e.g Response times, Status Codes, number of in flight requests
Prometheus Exporter for Kvrocks Metrics
Prometheus Kvrocks Metrics Exporter This is a fork of oliver006/redis_exporter to export the kvrocks metrics. Building and running the exporter Build
Monitor the performance of your Ethereum 2.0 staking pool.
eth-pools-metrics Monitor the performance of your Ethereum 2.0 staking pool. Just input the withdrawal credentials that were used in the deposit contr
A GO implementation of the Gathering Harcore programming competition 2011
CloudWars CloudWars is a GO implementation of the Gathering Harcore programming competition 2011 . This implementation offers more configuration optio
Prometheus metrics exporter for libvirt.
Libvirt exporter Prometheus exporter for vm metrics written in Go with pluggable metric collectors. Installation and Usage If you are new to Prometheu
Secure Time Sync Daemon
stsd - Secure Time Sync Daemon ============================== Set system date based on HTTP 'date' headers over TLS. Inspired by Whonix's sdwdate, an
A Prometheus metrics exporter for AWS that fills in gaps CloudWatch doesn't cover
YAAE (Yet Another AWS Exporter) A Prometheus metrics exporter for AWS that fills in gaps CloudWatch doesn't cover About This exporter is meant to expo
shoutrrr daemon
shoutrrr daemon Orginal repositories: shoutrrr repository shoutrrr documentation Installation & Configuration Create a services.yaml with the followin
InfluxDB metrics exporter for OpenCensus.io
opencensus-exporter-influxdb InfluxDB metrics exporter for OpenCensus.io Installation $ go get -u github.com/starvn/opencensus-exporter-influxdb Regi
Service for firewalling graphite metrics
hadrianus Block incoming graphite metrics if they come in too fast for downstream carbon-relay/carbon-cache to handle. Building Hadrianus is written i
An OOB interaction gathering server and client library
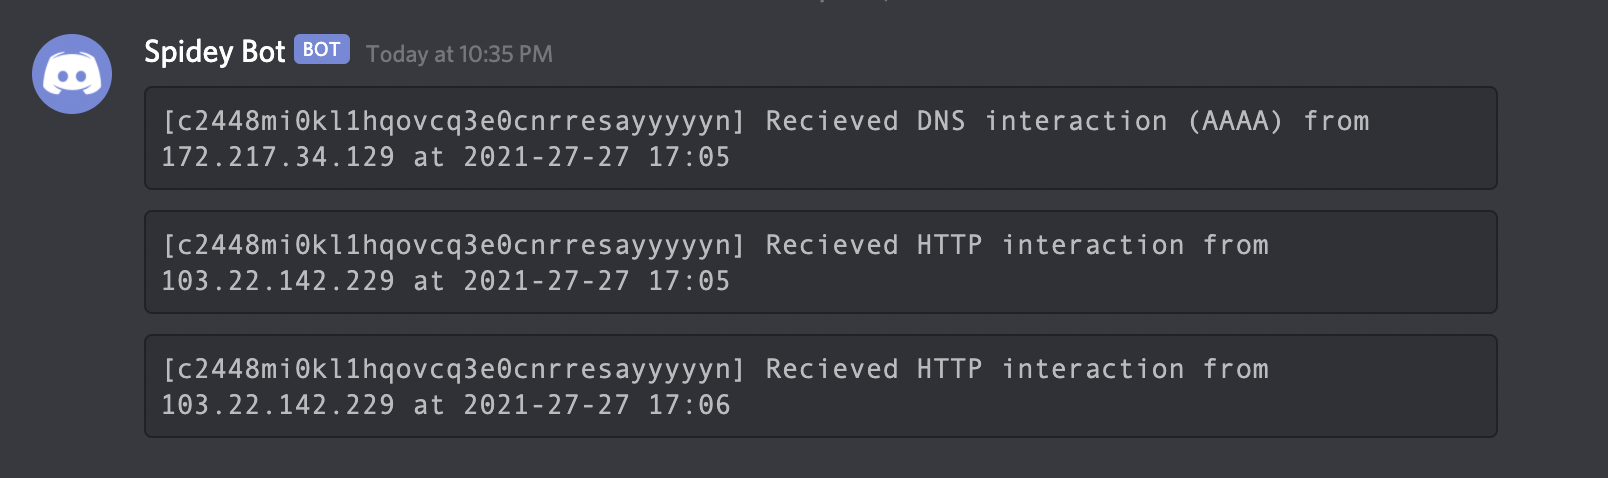
Interactsh An OOB interaction gathering server and client library Features • Usage • Interactsh Client • Interactsh Server • Interactsh Integration •
Shopping List webapp with Prometheus metrics endpoint
shopping-list Shopping List webapp with Prometheus metrics endpoint This is an example app with prometheus metrics integrated. This app runs on port 5
daemon for removing torrents from deluge after a specified timeframe
deluge-remove-after -- daemon for removing torrents from deluge after a specified timeframe Table of Contents Why Installation Docker Build from sourc
A Prometheus exporter which scrapes metrics from CloudLinux LVE Stats 2

CloudLinux LVE Exporter for Prometheus LVE Exporter - A Prometheus exporter which scrapes metrics from CloudLinux LVE Stats 2 Help on flags: -h, --h
A docker container that can be deployed as a sidecar on any kubernetes pod to monitor PSI metrics
CgroupV2 PSI Sidecar CgroupV2 PSI Sidecar can be deployed on any kubernetes pod with access to cgroupv2 PSI metrics. About This is a docker container
Information Gathering Tool written in Golang
Information Gathering Tool written in Golang