149 Resources
Golang monitoring Libraries
A simple, standalone, and lightWeight tool that can do health/status checking, written in Go.

EaseProbe EaseProbe is a simple, standalone, and lightWeight tool that can do health/status checking, written in Go. Table of Contents EaseProbe 1. Ov
A lib for monitoring runtime goroutine stack
Overview A lib for monitoring runtime goroutine stack. Such as wait for goroutines to exit, leak detection, etc. Features context.Context first design
Fast :zap: reverse proxy in front of any GraphQL server for caching, securing and monitoring.
Fast ⚡ reverse proxy in front of any GraphQL server for caching, securing and monitoring. Features 💾 Caching RFC7234 compliant HTTP Cache. Cache quer
IT Asset Fleet Remote Management and Monitoring (RMM) platform
ratd Remote Access Toolkit Daemon IT Asset Remote Management and Monitoring (RMM) platform How to use: You can't, just yet. Release Plan Release 0 Cre
Monitoring-go - A simple monitoring tool to sites of MOVA
Monitoring GO A simple monitoring tool to sites of MOVA How to use Clone Repo gi
Microservice responsible for the monitoring of active connections in RapidPro channels.
c-conn-watcher An application for watch active channel connections from specifc channels in Rapidpro and give metrics from this to serve for Prometheu
Qfy - Self-hosted implementation of Synthetics - Monitoring checks to validate your service availability
qfy Self-hosted implementation of Synthetics - Monitoring checks to validate you
Simple Golang tool for monitoring linux cpu, ram and disk usage.
Simple Golang tool for monitoring linux cpu, ram and disk usage.
Portmantool - Port scanning and monitoring tool
portmantool Port scanning and monitoring tool Components runner while true do r
Monitoriamento-go - Program for monitoring websites in Golang
***Programa para monitoriamento de sites em Go lang. *** No "sitesaqui.txt" colo
Yaf - Yet another system fetch that is minimal and customizable
Yaf - Yet Another Fetch [Support] [Installation] [Usage] Brief Yet Another Fetch
Monitor - API endpoints for system monitoring
System monitor Golang API for accessing system stats, linux-only $ curl -s http:
Rekor-sidekick - Rekor transparency log monitoring and alerting
🔍 Rekor Sidekick Rekor Sidekick monitors a Rekor signature transparency log and
Passive DNS Capture/Monitoring Framework
Table of Contents DNS Monster Main features Installation Linux Container Build Manually Build Statically Windows FreeBSD and MacOS Architecture AIO In
Metrics go: CudgX indicator management tool, which integrates monitoring and data analysis indicator capabilities
Metrics-Go metrics-go 是cudgx指标打点工具,它集成了监控和数据分析指标能力。 数据流程 指标数据流程为: 用户代码调用打点 SDK指标
Nightingale - A Distributed and High-Performance Monitoring System. Prometheus enterprise edition

Introduction 💡 A Distributed and High-Performance Monitoring System. Prometheus
A fast and lightweight interactive terminal based UI application for tracking cryptocurrencies 🚀

cointop Coin tracking for hackers cointop is a fast and lightweight interactive terminal based UI application for tracking and monitoring cryptocurren
Alertmanager-cli is a cli writtin in golang to silence alerts in AlertManager
Alertmanager-cli is a cli writtin in golang to silence alerts in AlertManager
Health-go - Web based app for health tracking and monitoring (Go port)
Health Web based app for health tracking and monitoring. Work in progress. Installation Clone the repository: git clone [email protected]:jonathantorr
metrics2.0 based, multi-tenant timeseries store for Graphite and friends.
Grafana Metrictank Introduction Grafana Metrictank is a multi-tenant timeseries platform that can be used as a backend or replacement for Graphite. It
A horizontally scalable, highly available, multi-tenant, long term Prometheus.
Cortex: horizontally scalable, highly available, multi-tenant, long term storage for Prometheus. Cortex provides horizontally scalable, highly availab
Distributed tracing using OpenTelemetry and ClickHouse
Distributed tracing backend using OpenTelemetry and ClickHouse Uptrace is a dist
Package bright-golang is a client for the Bright App energy monitoring API.
Go client library for the Bright API Package bright-golang is a client for the Bright App energy monitoring API. Not all the API endpoints are impleme
The Coherence command line interface (CLI) is a lightweight tool, in the tradition of tools such as kubectl
Coherence Command Line Interface (CLI) Contents Overview Why use the Coherence C
Making SLOs with Prometheus manageable, accessible, and easy to use for everyone!

Making SLOs with Prometheus manageable, accessible, and easy to use for everyone! Features Support for Kubernetes, Docker, and filesystem Alerting: Ge
⛑ Gatus - Automated service health dashboard
Gatus is a health dashboard that gives you the ability to monitor your services using HTTP, ICMP, TCP, and even DNS queries as well as evaluate the re
Instant Kubernetes-Native Application Observability

Pixie is an open source observability tool for Kubernetes applications. Use Pixie to view the high-level state of your cluster (service maps, cluster
Enterprise Network Flow Collector (IPFIX, sFlow, Netflow)

High-performance, scalable and reliable IPFIX, sFlow and Netflow collector (written in pure Golang). Features IPFIX RFC7011 collector sFLow v5 raw hea
System agent. Reports server status via HTTP API
sys-agent System agent is a simple service reporting server status via HTTP GET request. usage $ sys-agent -l :8080 -v "root:/" -v "data:/mnt/data" Ap
CPU usage percentage is the ratio of the total time the CPU was active, to the elapsed time of the clock on your wall.
Docker-Kubernetes-Container-CPU-Utilization Implementing CPU Load goroutine requires the user to call the goroutine from the main file. go CPULoadCalc
Kstone is an etcd management platform, providing cluster management, monitoring, backup, inspection, data migration, visual viewing of etcd data, and intelligent diagnosis.
Kstone 中文 Kstone is an etcd management platform, providing cluster management, monitoring, backup, inspection, data migration, visual viewing of etcd
PinGo is a standalone and feature-rich tool for common IP-based reachability checking tasks. Ping or Trace and Observe in real-time the statistics.
pingo As a network champion from designing and implementing to troubleshooting large scale networks - I know that is usually not easy for administrato
Enterprise Network Flow Collector (IPFIX, sFlow, Netflow)
High-performance, scalable and reliable IPFIX, sFlow and Netflow collector (written in pure Golang). Features IPFIX RFC7011 collector sFLow v5 raw hea
Fast, zero config web endpoint change monitor

web monitor fast, zero config web endpoint change monitor. for comparing responses, a selected list of http headers and the full response body is stor
Prometheus exporter for connext subgraphs
Subgraph monitoring exporter Prometheus exporter which provides metrics for monitoring multi subgraphs and rpc nodes by graphql request to graph-node
Monitoring stack app for golang
Monitoring Application This is a simple monitoring application taken from the following repositor: https://github.com/AnaisUrlichs/observe-argo-rollou
A realtime teenage driver behaviour monitoring system integrating OBII sensor, smart watch, smartphone, and Raspberry Pi, which examines over time novice teenage driving performance and risk
DriverMonitor A realtime teenage driver behaviour monitoring system integrating OBII sensor, smart watch, smartphone, and Raspberry Pi, which examines
Monitor & detect crashes in your Kubernetes(K8s) cluster

kwatch kwatch helps you monitor all changes in your Kubernetes(K8s) cluster, detects crashes in your running apps in realtime, and publishes notificat
Open Source Software monitoring platform tools.
ByteOpen Open Source Software monitoring platform tools. Usage Clone the repo to your own go src path cd ~/go/src git clone https://code.byted.org/inf
A profiling tool to peek and profile the memory or cpu usage of a process

Peekprof Get the CPU and Memory usage of a single process, monitor it live, and extract it in CSV and HTML. Get the best out of your optimizations. Us
Hard Drive S.M.A.R.T Monitoring, Historical Trends & Real World Failure Thresholds
Hard Drive S.M.A.R.T Monitoring, Historical Trends & Real World Failure Thresholds
Server motherboard hardware monitoring
hardware-events This software helps with the monitoring of a server motherboard. The project started when I changed the FANs on a Supermicro motherboa
Monitoring service uses variables with golang
Monitoring service Setting up Monitoring service uses variables. If no variables are set, the default values listed below will be used: PORT=8000 SECR
Ethereum clients monitor

e7mon Tool for monitoring your Ethereum clients. Client-agnostic as it queries the standardized JSON-RPC APIs. Requires the following APIs to be expos
A simple CLI tool to help you manage your CPU
gocpu A simple cli tool to handle and watch your CPU. Usage Usage gocpu [subcommand] [flags] subcommand: watch - see the realtime cpu frequenc
Monitoring Go application inside docker container by InfluxDB, Telegraf, Grafana

REST API for TreatField app Docker compose for TIG and Golang simple app: https://github.com/tochytskyi/treatfield-api/blob/main/docker-compose.yml Gr
Ansible-driven CI/CD and monitoring system
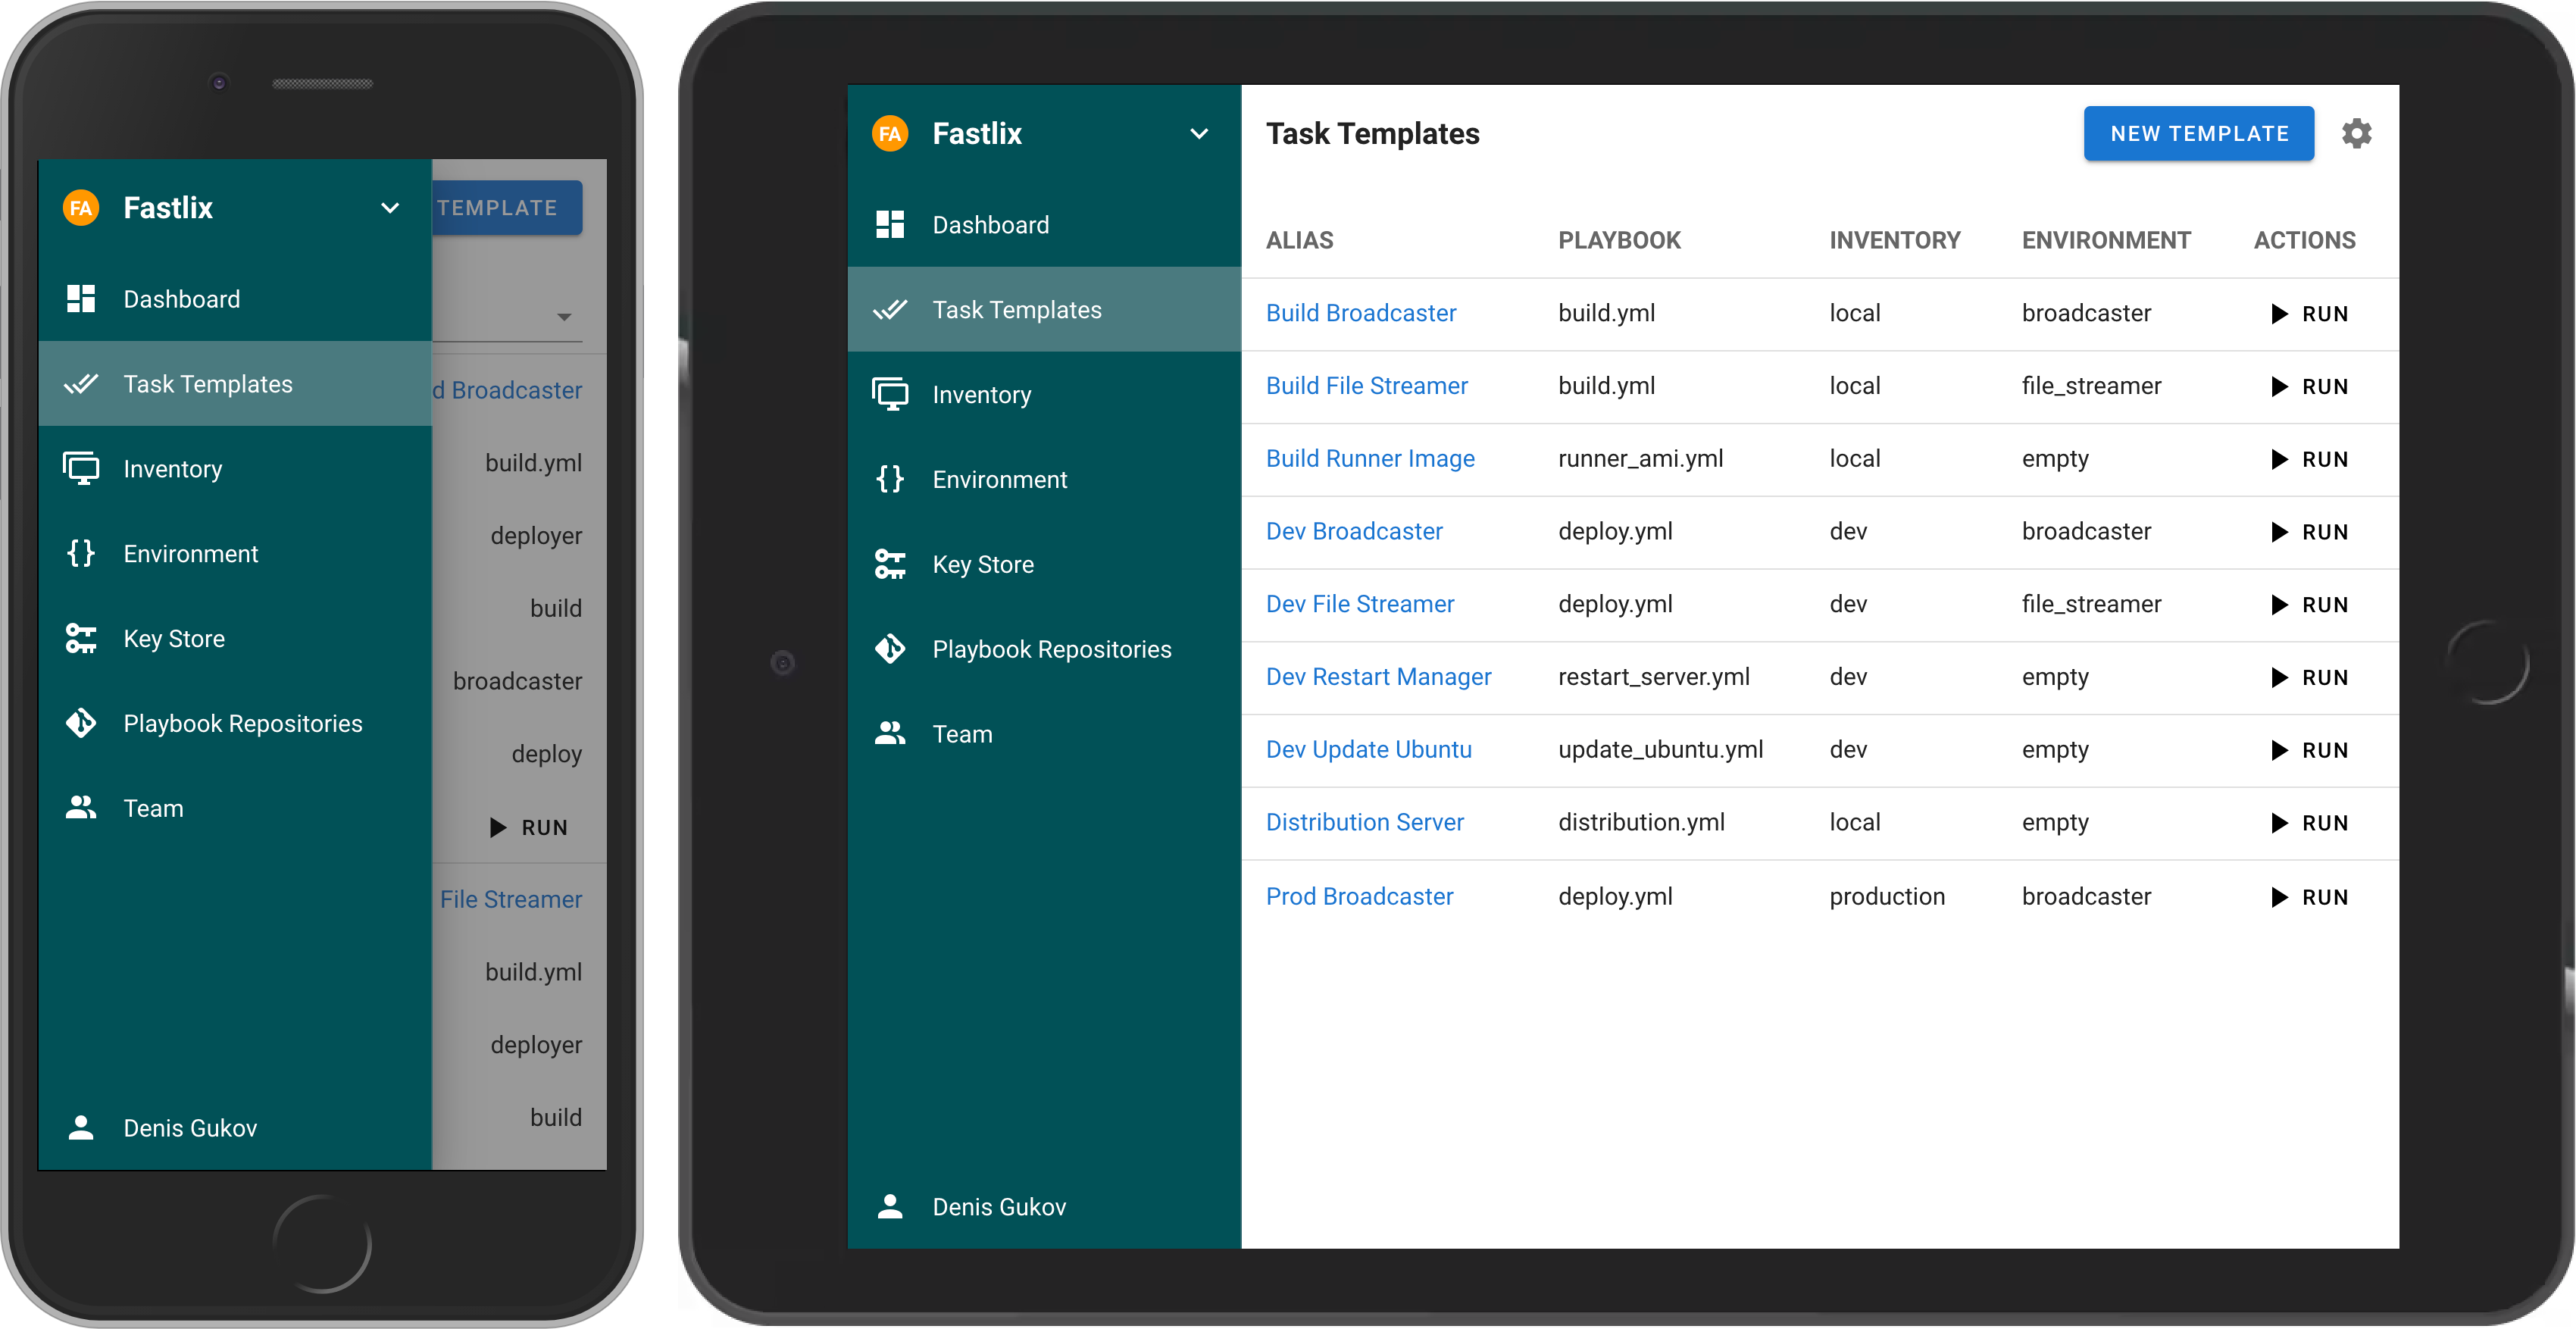
Ansible Semaphore Follow Semaphore on Twitter (AnsibleSem) and StackShare (ansible-semaphore). Ansible Semaphore is a modern UI for Ansible. It lets y
Next Generation Monitoring Server With Golang
Next Generation Monitoring Server Build make Arguments $ bin/ng-monitoring-server --help Usage of bin/ng-monitoring-server: --address string
Cloudprober is a monitoring software that makes it super-easy to monitor availability and performance of various components of your system.
Cloudprober is a monitoring software that makes it super-easy to monitor availability and performance of various components of your system. Cloudprobe
Schema-free, document-oriented streaming database that optimized for monitoring network traffic in real-time
Basenine Schema-free, document-oriented streaming database that optimized for monitoring network traffic in real-time. Featured Aspects Has the fastes
Metrics package helps to create ydb-go-sdk traces with monitoring internal state of driver
metrics metrics package helps to create ydb-go-sdk traces with monitoring internal state of driver Usage import ( "fmt" "sync/mutex" "time
A prometheus exporter for monitoring FIO nodeos nodes.

fio-prometheus-exporter This is a simple prometheus exporter for FIO nodeos nodes. It can connect to multiple nodes to display a few critical statisti
Tool for monitoring your Ethereum clients. Client-agnostic as it queries the standardized JSON-RPC APIs

e7mon Tool for monitoring your Ethereum clients. Client-agnostic as it queries the standardized JSON-RPC APIs. However, the execution client should be
🚨 Collection of Prometheus alerting rules
👋 Awesome Prometheus Alerts Most alerting rules are common to every Prometheus setup. We need a place to find them all. 🤘 🚨 📊 Collection available
⎈❏ Terminal and Web console for Kubernetes
Kubebox ⎈❏ Terminal and Web console for Kubernetes Features ✓ Configuration from kubeconfig files (KUBECONFIG environment variable or $HOME/.kube) ✓ S
Continuous profiling for analysis of CPU, memory usage over time, and down to the line number. Saving infrastructure cost, improving performance, and increasing reliability.

Continuous profiling for analysis of CPU, memory usage over time, and down to the line number. Saving infrastructure cost, improving performance, and increasing reliability.
Fleet - Open source device management, built on osquery.

Fleet - Open source device management, built on osquery.
A simple tool who pulls data from Online.net API and parse them to a Prometheus format
Dedibox backup monitoring A simple tool who reads API from Online.net and parse them into a Prometheus-compatible format. Conceived to be lightweight,
Detecctor is a ⚡ fast, fully customizable 💗 monitoring platform. It uses Telegram as a notification 📥 service
Detecctor is a ⚡ fast, fully customizable 💗 monitoring platform. It uses Telegram as a notification 📥 service. The main components are a TCP server, MongoDB and multiple clients.
SigNoz helps developers monitor their applications & troubleshoot problems, an open-source alternative to DataDog, NewRelic, etc. 🔥 🖥. 👉 Open source Application Performance Monitoring (APM) & Observability tool
Monitor your applications and troubleshoot problems in your deployed applications, an open-source alternative to DataDog, New Relic, etc. Documentatio
mtail - extract internal monitoring data from application logs for collection into a timeseries database
mtail - extract internal monitoring data from application logs for collection into a timeseries database mtail is a tool for extracting metrics from a
Alert dashboard for Prometheus Alertmanager

karma Alert dashboard for Prometheus Alertmanager. Alertmanager =0.19.0 is required as older versions might not show all receivers in karma, see issu
Monitoring and automation for Open Source email servers, starting with Postfix.
Welcome to Lightmeter Control Center, the Open Source mailops monitoring application.
A proxy to add `/federate` to Thanos monitoring
Thanos Federate Proxy A proxy to convert /federate queries to /v1/api/query and respond in open metrics format. The most common use case for this prox
Command line monitoring for goroutines
grmon Command line monitoring for goroutines Install go get -u github.com/bcicen/grmon Usage Simply import and call grmon.Start() somewhere in your co
A proxy that authorizes and enforces a given label in a given PromQL query
prom-authzed-proxy prom-authzed-proxy is a proxy for Prometheus that authorizes the request's Bearer Token with Authzed and enforces a label in a Prom
checkah is an agentless SSH system monitoring and alerting tool.
CHECKAH checkah is an agentless SSH system monitoring and alerting tool. Features: agentless check over SSH (password, keyfile, agent) config file bas
Prometheus metrics for Go database/sql via VictoriaMetrics/metrics
sqlmetrics Prometheus metrics for Go database/sql via VictoriaMetrics/metrics Features Simple API. Easy to integrate. Install Go version 1.16+ go get
A tool for visualization and monitoring Redis cluster realtime

Redat is a tool for visualize Redis-cluster on terminal Features: Visualize master-replicas relations in the Redis cluster Monitor with metrics: memor
gosivy - Real-time visualization tool for Go process metrics

Gosivy tracks Go process's metrics and plot their evolution over time right into your terminal, no matter where it's running on. It helps you understand how your application consumes the resources.
Nvidia GPU exporter for prometheus using nvidia-smi binary
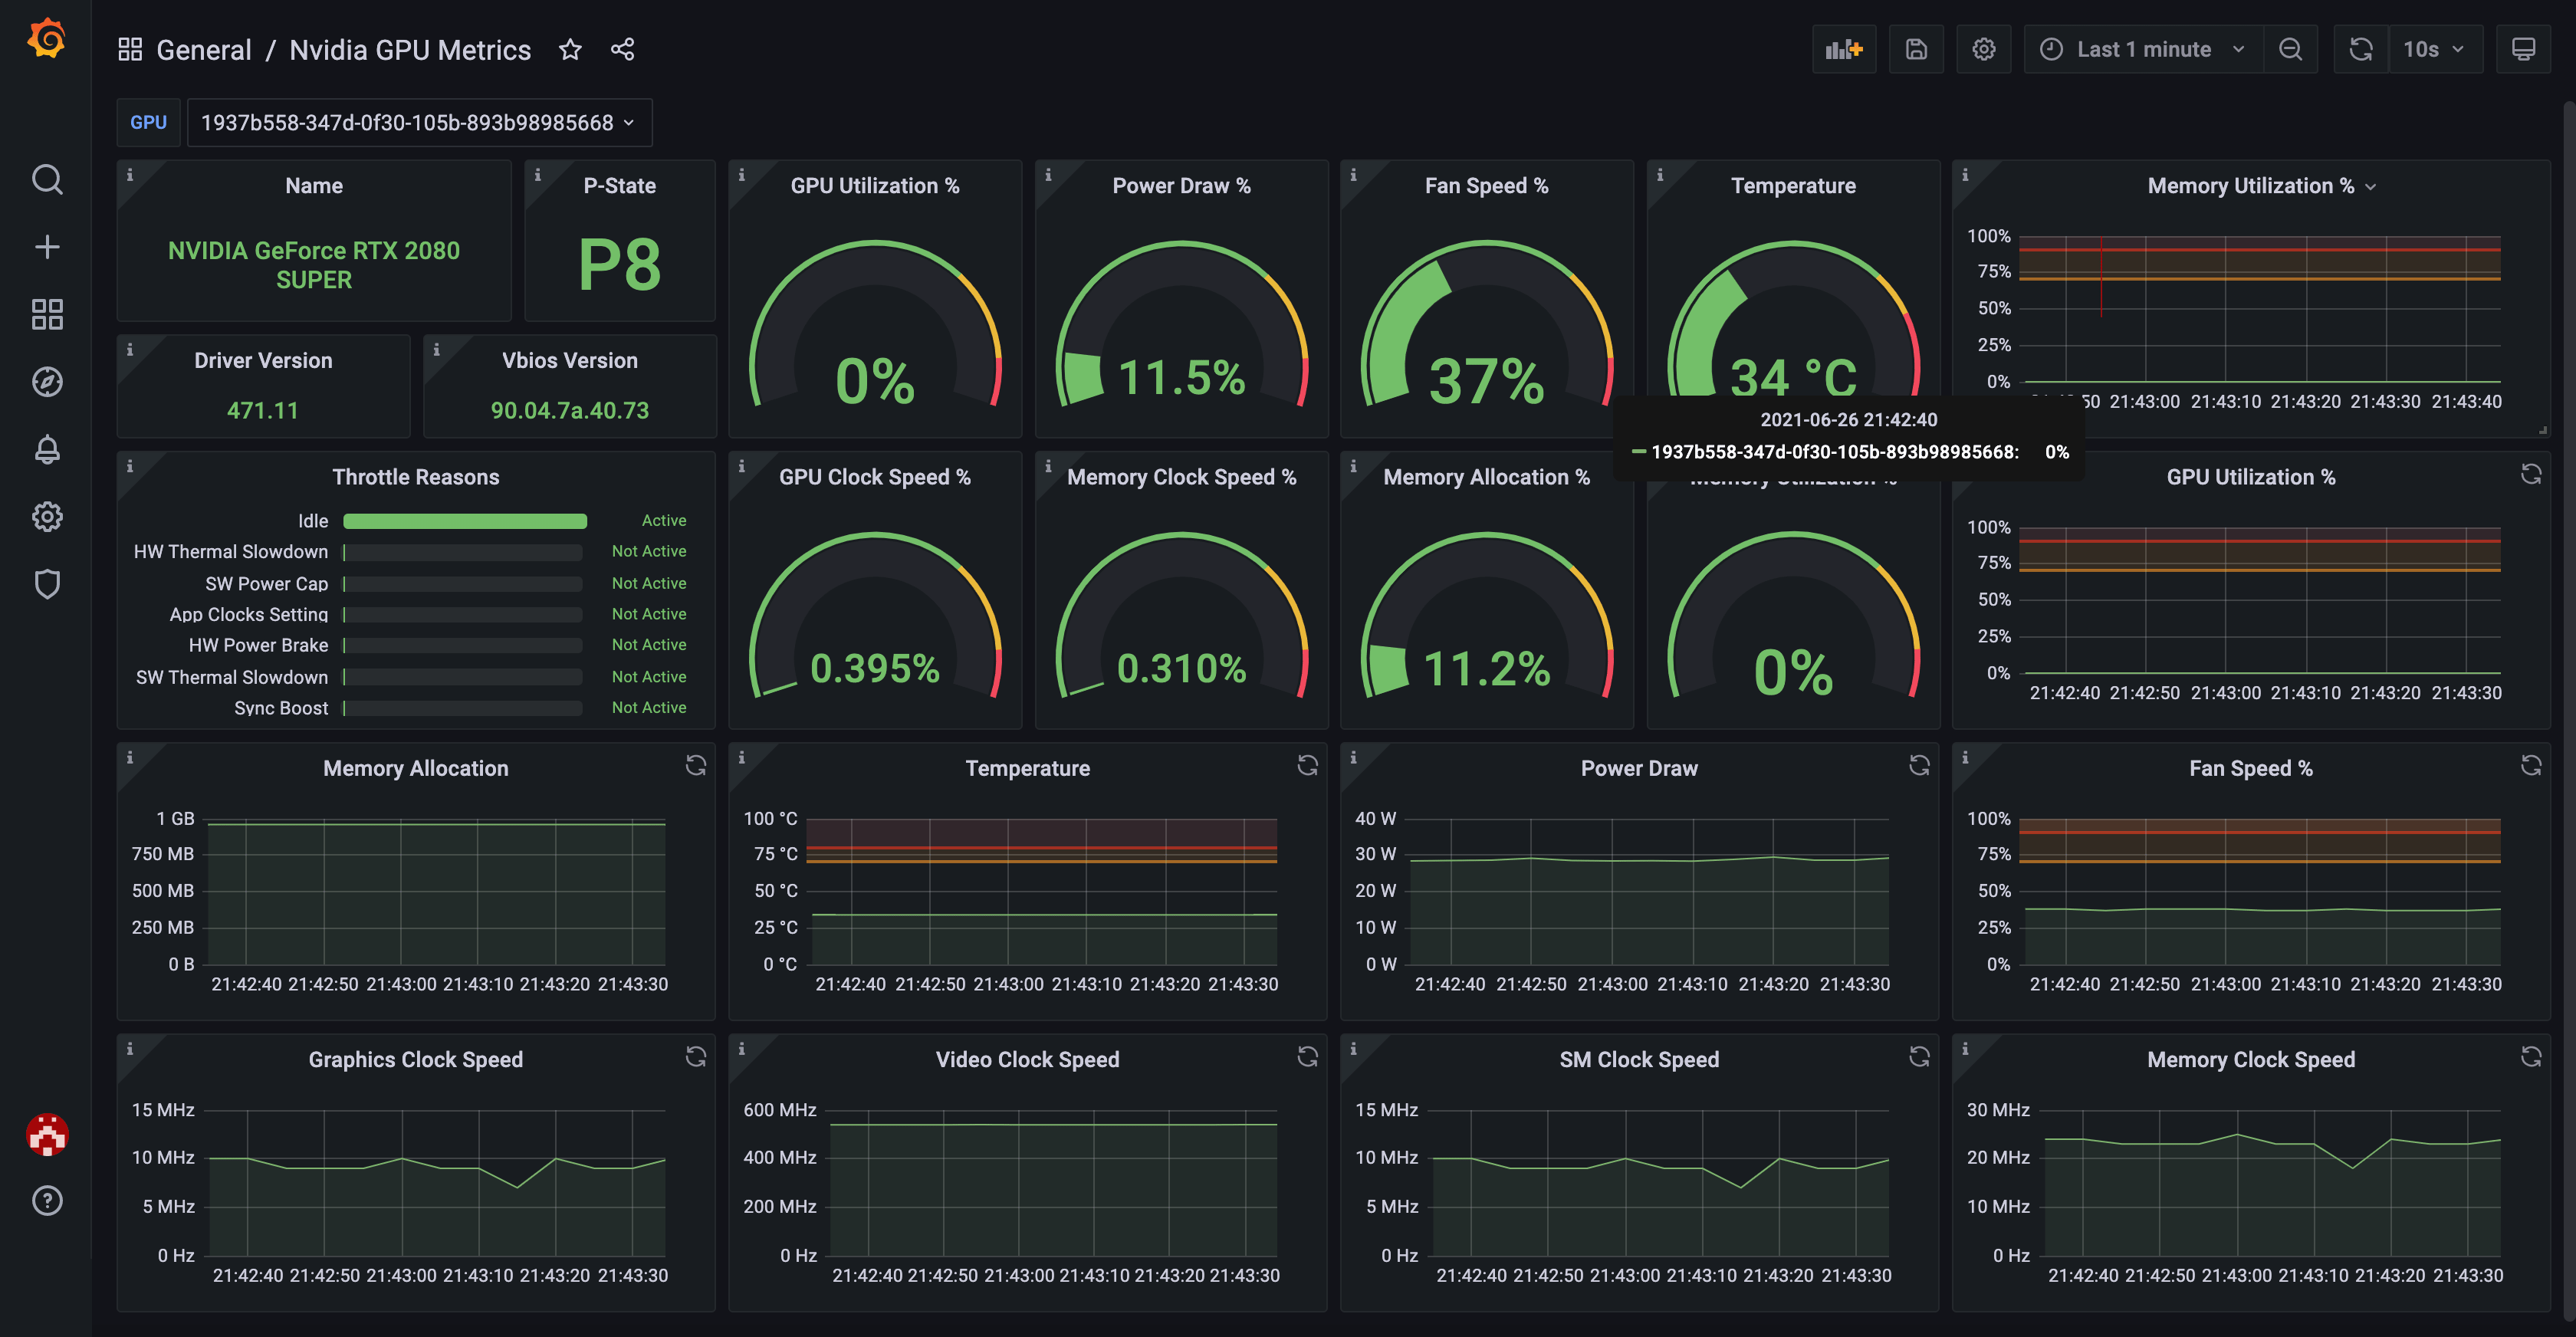
nvidia_gpu_exporter Nvidia GPU exporter for prometheus, using nvidia-smi binary to gather metrics. Introduction There are many Nvidia GPU exporters ou
Mortar is a GO framework/library for building gRPC (and REST) web services.

Mortar Mortar is a GO framework/library for building gRPC (and REST) web services. Mortar has out-of-the-box support for configuration, application me
TCPProbe is a modern TCP tool and service for network performance observability.

TCPProbe is a modern TCP tool and service for network performance observability. It exposes information about socket’s underlying TCP session, TLS and HTTP (more than 60 metrics). you can run it through command line or as a service. the request is highly customizable and you can integrate it with your application through gRPC. it runs in a Kubernetes cluster as cloud native application and by adding annotations on pods allow a fine control of the probing process.
gosivy - Another visualization tool for Go process metrics
gosivy Another visualization tool for Go process metrics. Gosivy tracks Go process's metrics and plot their evolution over time right into your termin
Tool for monitoring network devices (mainly using SNMP) - monitoring check plugin
Thola Description A tool for monitoring network devices written in Go. It features a check mode which complies with the monitoring plugins development
Lux is a command-line interface for controlling and monitoring Govee lighting strips built in Go.
What is Lux? Lux is a command-line interface for controlling and monitoring Govee lighting strips built in Go. Lux provides it's users with the abilit
Gowl is a process management and process monitoring tool at once. An infinite worker pool gives you the ability to control the pool and processes and monitor their status.

Gowl is a process management and process monitoring tool at once. An infinite worker pool gives you the ability to control the pool and processes and monitor their status.
A K8s ClusterIP HTTP monitoring library based on eBPF
Owlk8s Seamless RED monitoring of k8s ClusterIP HTTP services. This library provides RED (rate,error,duration) monitoring for all(by default but exclu
Gohalt 👮♀🛑: Fast; Simple; Powerful; Go Throttler library

Gohalt 👮♀ 🛑 : Fast; Simple; Powerful; Go Throttler library go get -u github.com/1pkg/gohalt Introduction Gohalt is simple and convenient yet powerf
El Carro is a new project that offers a way to run Oracle databases in Kubernetes as a portable, open source, community driven, no vendor lock-in container orchestration system. El Carro provides a powerful declarative API for comprehensive and consistent configuration and deployment as well as for real-time operations and monitoring.
El Carro: The Oracle Operator for Kubernetes Run Oracle on Kubernetes with El Carro El Carro is a new project that offers a way to run Oracle database
🦥 Easy and simple Prometheus SLO generator
Sloth Introduction Use the easiest way to generate SLOs for Prometheus. Sloth generates understandable, uniform and reliable Prometheus SLOs for any k
Pixie gives you instant visibility by giving access to metrics, events, traces and logs without changing code.

Pixie gives you instant visibility by giving access to metrics, events, traces and logs without changing code.
SigNoz helps developer monitor applications and troubleshoot problems in their deployed applications
SigNoz helps developers monitor their applications & troubleshoot problems, an open-source alternative to DataDog, NewRelic, etc. 🔥 🖥
💡 A Distributed and High-Performance Monitoring System. The next generation of Open-Falcon
夜莺简介 夜莺是一套分布式高可用的运维监控系统,最大的特点是混合云支持,既可以支持传统物理机虚拟机的场景,也可以支持K8S容器的场景。同时,夜莺也不只是监控,还有一部分CMDB的能力、自动化运维的能力,很多公司都基于夜莺开发自己公司的运维平台。开源的这部分功能模块也是商业版本的一部分,所以可靠性有保
Distributed simple and robust release management and monitoring system.

Agente Distributed simple and robust release management and monitoring system. **This project on going work. Road map Core system First worker agent M
Monitor your network and internet speed with Docker & Prometheus

Stand-up a Docker Prometheus stack containing Prometheus, Grafana with blackbox-exporter, and speedtest-exporter to collect and graph home Internet reliability and throughput.
LinDB is an open-source Time Series Database which provides high performance, high availability and horizontal scalability.
LinDB is an open-source Time Series Database which provides high performance, high availability and horizontal scalability. LinDB stores all monitoring data of ELEME Inc, there is 88TB incremental writes per day and 2.7PB total raw data.
Top-like interface for container metrics
Top-like interface for container metrics ctop provides a concise and condensed overview of real-time metrics for multiple containers: as well as a sin
A fast and lightweight interactive terminal based UI application for tracking cryptocurrencies 🚀
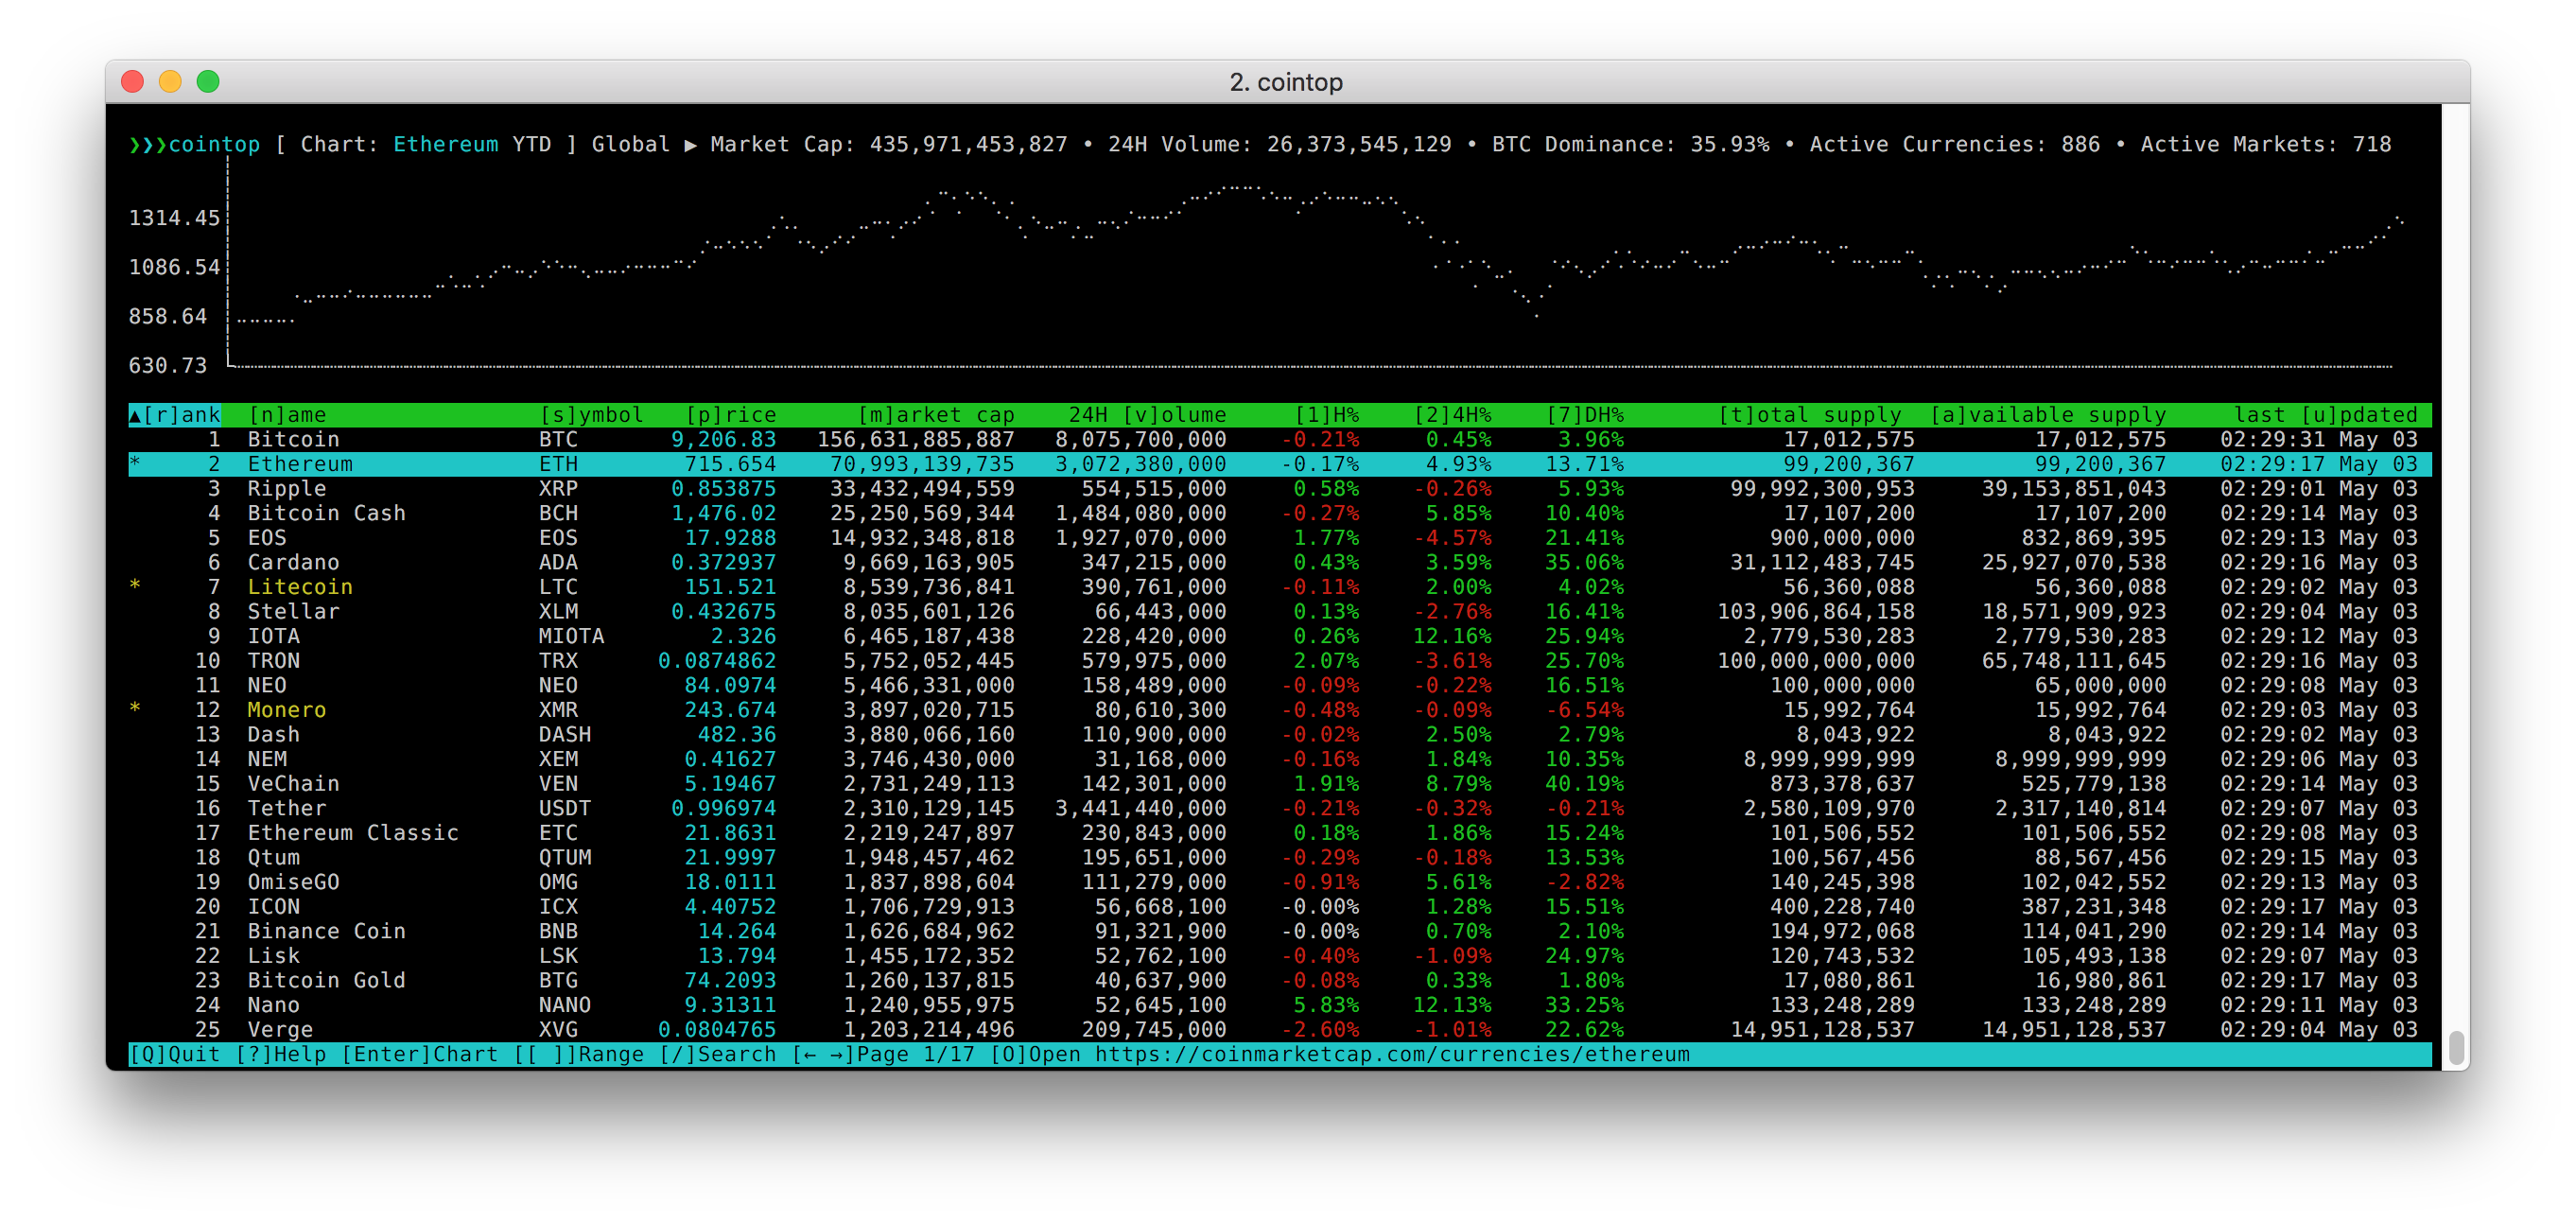
cointop is a fast and lightweight interactive terminal based UI application for tracking and monitoring cryptocurrency coin stats in real-time.
Squzy - is a high-performance open-source monitoring, incident and alert system written in Golang with Bazel and love.
Squzy - opensource monitoring, incident and alerting system About Squzy - is a high-performance open-source monitoring and alerting system written in
An open-source and enterprise-level monitoring system.
Falcon+ Documentations Usage Open-Falcon API Prerequisite Git = 1.7.5 Go = 1.6 Getting Started Docker Please refer to ./docker/README.md. Build from
go-sysinfo is a library for collecting system information.
go-sysinfo go-sysinfo is a library for collecting system information. This includes information about the host machine and processes running on the ho
Scalable datastore for metrics, events, and real-time analytics
InfluxDB InfluxDB is an open source time series platform. This includes APIs for storing and querying data, processing it in the background for ETL or
Tool for shell commands execution, visualization and alerting. Configured with a simple YAML file.
Sampler. Visualization for any shell command. Sampler is a tool for shell commands execution, visualization and alerting. Configured with a simple YAM
Generate HTTP load and plot the results in real-time

ali A load testing tool capable of performing real-time analysis, inspired by vegeta and jplot. ali comes with an embedded terminal-based UI where you
A system and resource monitoring tool written in Golang!

Grofer A clean and modern system and resource monitor written purely in golang using termui and gopsutil! Currently compatible with Linux only. Curren
Open source Observability Platform. 👉 SigNoz helps developers find issues in their deployed applications & solve them quickly
SigNoz SigNoz is an opensource observability platform. SigNoz uses distributed tracing to gain visibility into your systems and powers data using Kafk
An always-on framework that performs end-to-end functional network testing for reachability, latency, and packet loss
Arachne Arachne is a packet loss detection system and an underperforming path detection system. It provides fast and easy active end-to-end functional
A goroutine monitor to keep track of active routines from within your favorite shell.

roumon A goroutine monitor to keep track of active routines from within your favorite shell. Features Track live state of all active goroutines Termin
Reduce Chaos in MemPool 😌

harmony Reduce Chaos in MemPool 😌 Table of Contents Why did you write harmony ? What do I need to have for installing harmony ? How do I get harmony