Grafana Tempo is a high volume, minimal dependency distributed tracing backend.

Tempo Logo

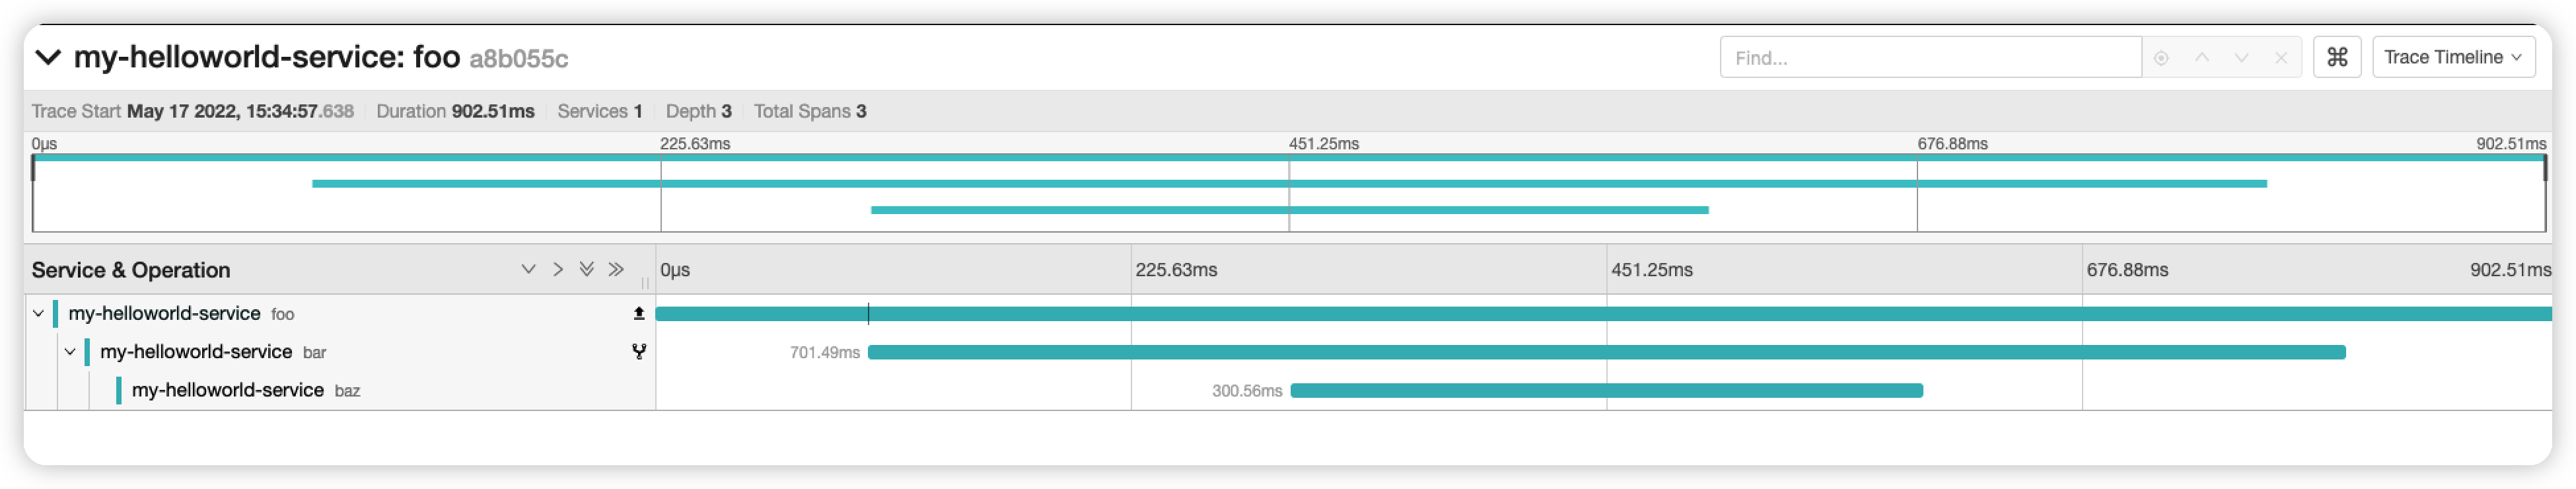
Grafana Tempo is an open source, easy-to-use and high-scale distributed tracing backend. Tempo is cost-efficient, requiring only object storage to operate, and is deeply integrated with Grafana, Prometheus, and Loki. Tempo can be used with any of the open source tracing protocols, including Jaeger, Zipkin, OpenCensus, Kafka, and OpenTelemetry. It supports key/value lookup only and is designed to work in concert with logs and metrics (exemplars) for discovery.

Tempo is Jaeger, Zipkin, Kafka, OpenCensus and OpenTelemetry compatible. It ingests batches in any of the mentioned formats, buffers them and then writes them to Azure, GCS, S3 or local disk. As such it is robust, cheap and easy to operate!

Getting Started

Further Reading

To learn more about Tempo, consult the following documents & talks:

Getting Help

If you have any questions or feedback regarding Tempo:

OpenTelemetry

Tempo's receiver layer, wire format and storage format are all based directly on standards and code established by OpenTelemetry. We support open standards at Grafana!

Check out the Integration Guides to see examples of OpenTelemetry instrumentation with Tempo.

Other Components

tempo-query

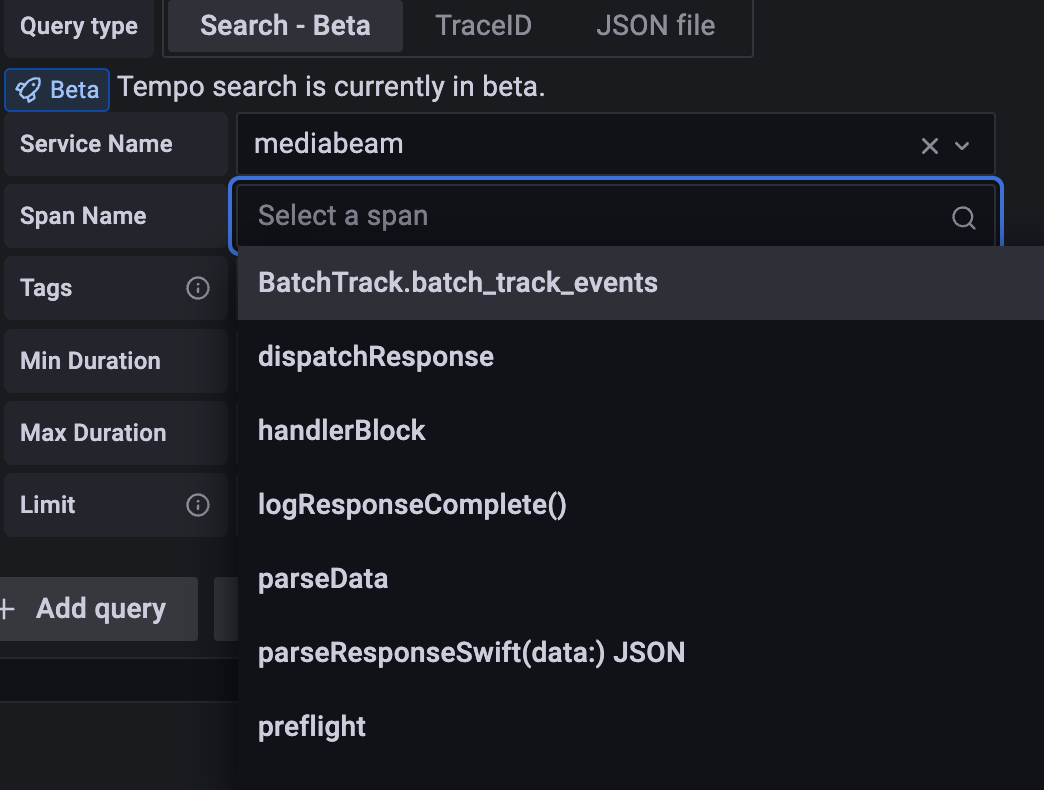
tempo-query is jaeger-query with a hashicorp go-plugin to support querying Tempo. Please note that tempo only looks up a trace by ID. Searching for traces is not supported, and the service and operation lists will not populate.

tempo-vulture

tempo-vulture is tempo's bird themed consistency checking tool. It pushes traces and queries Tempo. It metrics 404s and traces with missing spans.

tempo-cli

tempo-cli is the place to put any utility functionality related to tempo. See Documentation for more info.

TempoDB

TempoDB is included in the this repository but is meant to be a stand alone key value database built on top of cloud object storage (azure/gcs/s3). It is a natively multitenant, supports a WAL and is the storage engine for Tempo.

License

Grafana Tempo is distributed under AGPL-3.0-only. For Apache-2.0 exceptions, see LICENSING.md.

Owner
Grafana Labs
Grafana Labs is behind leading open source projects Grafana and Loki, and the creator of the first open & composable observability platform.
Grafana Labs
Comments
  • S3 disk space usage always increasing

    S3 disk space usage always increasing

    Describe the bug Hi all, I've Tempo deployed in microservices mode in my Kubernetes cluster and my Minio S3 storage disk space usage is always increasing even if Compactor is set to use 1h of retention.

    Here is my config:

    compactor:
            compaction:
                block_retention: 1h
                compacted_block_retention: 15m
        distributor: {}
        http_api_prefix: ""
        ingester:
            lifecycler:
                ring:
                    replication_factor: 3
        memberlist:
            abort_if_cluster_join_fails: false
            bind_port: 7946
            join_members:
                - gossip-ring.tempo.svc.cluster.local.:7946
        metrics_generator:
            storage:
                remote_write:
                    - name: remote-write
                      send_exemplars: true
                      url: http://kube-prometheus-stack-prometheus.monitoring.svc.cluster.local:9090/api/v1/write
        metrics_generator_enabled: true
        multitenancy_enabled: true
        overrides:
            per_tenant_override_config: /overrides/overrides.yaml
        querier:
            frontend_worker:
                grpc_client_config:
                    max_send_msg_size: 1.34217728e+08
        search_enabled: true
        server:
            grpc_server_max_recv_msg_size: 1.34217728e+08
            grpc_server_max_send_msg_size: 1.34217728e+08
            http_listen_port: 3200
        storage:
            trace:
                azure: {}
                backend: s3
                blocklist_poll: "0"
                cache: memcached
                gcs: {}
                memcached:
                    consistent_hash: true
                    host: memcached
                    service: memcached-client
                    timeout: 200ms
                pool:
                    queue_depth: 2000
                s3:
                    access_key: ${S3_ACCESS_KEY}
                    bucket: tempo
                    endpoint: minio.minio.svc.cluster.local:9000
                    insecure: true
                    secret_key: ${S3_SECRET_KEY}
                wal:
                    path: /var/tempo/wal
    

    To Reproduce Steps to reproduce the behavior:

    1. Deploy Tempo in microservices mode with Minio as S3 storage
    2. Set Compactor with 1h of retention
    3. Start sending traces to Tempo
    4. Observe Minio disk space usage

    Expected behavior Disk space usage should decrease with compaction cycles.

    Environment:

    • Infrastructure: Kubernetes
    • Deployment tool: jsonnet

    Additional Context

  • Azure DNS Lookup Failures

    Azure DNS Lookup Failures

    Describe the bug In Azure all components can register DNS errors while trying to work with meta.compacted.json. This issue does not occur in any other environments. Unsure if this is an Azure issue or a Tempo issue. The error itself is a failed tcp connection to a DNS server which suggests this is some issue with Azure infrastructure. However, the fact that the error (almost?) always occurs on meta.compacted.json suggests something about the way we handle that file is different and is causing this issue.

    The failures look like:

    reading storage container: Head "https://tempoe**************.blob.core.windows.net/tempo/single-tenant/d8aafc48-5796-4221-ac0b-58e001d18515/meta.compacted.json?timeout=61": dial tcp: lookup tempoe**************.blob.core.windows.net on 10.0.0.10:53: dial udp 10.0.0.10:53: operation was canceled
    

    or

    error deleting blob, name: single-tenant/*******************/data: Delete "https://tempoe******.blob.core.windows.net/tempo/single-tenant/5b1ab746-fee7-409c-944d-1c1d5ba7a70e/data?timeout=61": dial tcp: lookup tempoe******.blob.core.windows.net on 10.0.0.10:53: dial udp 10.0.0.10:53: operation was canceled
    

    We have seen this issue internally. Also reported here: #1372.

  • Backend not hit

    Backend not hit

    Describe the bug We're using Tempo v1.3.1 with Grafana 8.3.6 and S3 as the storage backend. It seems like when we query traces for multiple hours (e.g. last 24h) only the ingester is queried for its data (which is always around the last 1-2h). When we chose a time range between now-1h and now-24h the 23h are returned correctly. You also "feel" that the backend is hit because it takes much longer.

    So it seems like when you query a time range where both the ingester and the object storage should be hit, only the ingester is.

    To Reproduce Steps to reproduce the behavior:

    1. Try to query the last 24h hours with default config for "query_ingesters_until" and "query_backend_after". See that it only returns the last 1-2 hours.
    2. Try to query now-24h to now-1h see that it returns the requested 23h and hits the object storage.

    Expected behavior When requesting the last 24h Tempo should return the whole 24h.

    Environment:

    • Infrastructure: Kubernetes
    • Deployment tool: helm (tempo-distributed chart v0.15.2)

    Additional Context

    Rendered Tempo config

    query_frontend:
      search:
        max_duration: 0
    multitenancy_enabled: false
    search_enabled: true
    compactor:
      compaction:
        block_retention: 1440h
      ring:
        kvstore:
          store: memberlist
    distributor:
      ring:
        kvstore:
          store: memberlist
      receivers:
        jaeger:
          protocols:
            thrift_compact:
              endpoint: 0.0.0.0:6831
            thrift_binary:
              endpoint: 0.0.0.0:6832
            thrift_http:
              endpoint: 0.0.0.0:14268
            grpc:
              endpoint: 0.0.0.0:14250
        otlp:
          protocols:
            http:
              endpoint: 0.0.0.0:55681
            grpc:
              endpoint: 0.0.0.0:4317
    querier:
      frontend_worker:
        frontend_address: tempo-tempo-distributed-query-frontend-discovery:9095
    ingester:
      lifecycler:
        ring:
          replication_factor: 1
          kvstore:
            store: memberlist
        tokens_file_path: /var/tempo/tokens.json
    memberlist:
      abort_if_cluster_join_fails: false
      join_members:
        - tempo-tempo-distributed-gossip-ring
    overrides:
      max_search_bytes_per_trace: 0
      per_tenant_override_config: /conf/overrides.yaml
    server:
      http_listen_port: 3100
      log_level: info
      log_format: json
      grpc_server_max_recv_msg_size: 4.194304e+06
      grpc_server_max_send_msg_size: 4.194304e+06
    storage:
      trace:
        backend: s3
        s3:
          bucket: XXXXX
          endpoint: s3.eu-central-1.amazonaws.com
          region: eu-central-1
        blocklist_poll: 5m
        local:
          path: /var/tempo/traces
        wal:
          path: /var/tempo/wal
        cache: memcached
        memcached:
          consistent_hash: true
          host: tempo-tempo-distributed-memcached
          service: memcached-client
          timeout: 500ms
    

    Helm values

        compactor:
          config:
            compaction:
              block_retention: 1440h
        config: |
          #--- This section is manually inserted (Robin) ---
          query_frontend:
            search:
              {{- if .Values.queryFrontend.extraConfig.max_duration }}
              max_duration: {{ .Values.queryFrontend.extraConfig.max_duration }}
              {{- else }}
              max_duration: 1h1m0s
              {{- end }}
          #-------------------------------------------------
          multitenancy_enabled: false
          search_enabled: {{ .Values.search.enabled }}
          compactor:
            compaction:
              block_retention: {{ .Values.compactor.config.compaction.block_retention }}
            ring:
              kvstore:
                store: memberlist
          distributor:
            ring:
              kvstore:
                store: memberlist
            receivers:
              {{- if  or (.Values.traces.jaeger.thriftCompact) (.Values.traces.jaeger.thriftBinary) (.Values.traces.jaeger.thriftHttp) (.Values.traces.jaeger.grpc) }}
              jaeger:
                protocols:
                  {{- if .Values.traces.jaeger.thriftCompact }}
                  thrift_compact:
                    endpoint: 0.0.0.0:6831
                  {{- end }}
                  {{- if .Values.traces.jaeger.thriftBinary }}
                  thrift_binary:
                    endpoint: 0.0.0.0:6832
                  {{- end }}
                  {{- if .Values.traces.jaeger.thriftHttp }}
                  thrift_http:
                    endpoint: 0.0.0.0:14268
                  {{- end }}
                  {{- if .Values.traces.jaeger.grpc }}
                  grpc:
                    endpoint: 0.0.0.0:14250
                  {{- end }}
              {{- end }}
              {{- if .Values.traces.zipkin}}
              zipkin:
                endpoint: 0.0.0.0:9411
              {{- end }}
              {{- if or (.Values.traces.otlp.http) (.Values.traces.otlp.grpc) }}
              otlp:
                protocols:
                  {{- if .Values.traces.otlp.http }}
                  http:
                    endpoint: 0.0.0.0:55681
                  {{- end }}
                  {{- if .Values.traces.otlp.grpc }}
                  grpc:
                    endpoint: 0.0.0.0:4317
                  {{- end }}
              {{- end }}
              {{- if .Values.traces.opencensus }}
              opencensus:
                endpoint: 0.0.0.0:55678
              {{- end }}
              {{- if .Values.traces.kafka }}
              kafka:
                {{- toYaml .Values.traces.kafka | nindent 6 }}
              {{- end }}
          querier:
            frontend_worker:
              frontend_address: {{ include "tempo.queryFrontendFullname" . }}-discovery:9095
              {{- if .Values.querier.config.frontend_worker.grpc_client_config }}
              grpc_client_config:
                {{- toYaml .Values.querier.config.frontend_worker.grpc_client_config | nindent 6 }}
              {{- end }}
          ingester:
            lifecycler:
              ring:
                replication_factor: 1
                kvstore:
                  store: memberlist
              tokens_file_path: /var/tempo/tokens.json
          memberlist:
            abort_if_cluster_join_fails: false
            join_members:
              - {{ include "tempo.fullname" . }}-gossip-ring
          overrides:
            {{- toYaml .Values.global_overrides | nindent 2 }}
          server:
            http_listen_port: {{ .Values.server.httpListenPort }}
            log_level: {{ .Values.server.logLevel }}
            log_format: {{ .Values.server.logFormat }}
            grpc_server_max_recv_msg_size: {{ .Values.server.grpc_server_max_recv_msg_size }}
            grpc_server_max_send_msg_size: {{ .Values.server.grpc_server_max_send_msg_size }}
          storage:
            trace:
              backend: {{.Values.storage.trace.backend}}
              {{- if eq .Values.storage.trace.backend "gcs"}}
              gcs:
                {{- toYaml .Values.storage.trace.gcs | nindent 6}}
              {{- end}}
              {{- if eq .Values.storage.trace.backend "s3"}}
              s3:
                {{- toYaml .Values.storage.trace.s3 | nindent 6}}
              {{- end}}
              {{- if eq .Values.storage.trace.backend "azure"}}
              azure:
                {{- toYaml .Values.storage.trace.azure | nindent 6}}
              {{- end}}
              blocklist_poll: 5m
              local:
                path: /var/tempo/traces
              wal:
                path: /var/tempo/wal
              cache: memcached
              memcached:
                consistent_hash: true
                host: {{ include "tempo.fullname" . }}-memcached
                service: memcached-client
                timeout: 500ms
        distributor:
          replicas: 1
        gateway:
          enabled: true
        global_overrides:
          max_search_bytes_per_trace: 0
        ingester:
          persistence:
            enabled: true
          replicas: 1
        memcachedExporter:
          enabled: true
        querier:
          replicas: 1
        queryFrontend:
          extraConfig:
            max_duration: "0"
          replicas: 1
        search:
          enabled: true
        server:
          logFormat: json
        serviceAccount:
          annotations:
            eks.amazonaws.com/role-arn: arn:aws:iam::XXXXX
          name: tempo
        serviceMonitor:
          enabled: true
        storage:
          trace:
            backend: s3
            s3:
              bucket: XXXXX
              endpoint: s3.eu-central-1.amazonaws.com
              region: eu-central-1
        traces:
          jaeger:
            grpc: true
            thriftBinary: true
            thriftCompact: true
            thriftHttp: true
          otlp:
            grpc: true
            http: true
    
  • No Trace details found in Tempo-query UI

    No Trace details found in Tempo-query UI

    Describe the bug Not able to fetch Trace details generated by java client application

    To Reproduce Steps to reproduce the behavior:

    1. Started docker container using the compose file (https://github.com/grafana/tempo/blob/master/example/docker-compose/docker-compose.loki.yaml)
    2. Made some changes to the above file, 2.1. Removed port conflicts between TEMPO & Loki ports 2.2. Changed hostname to localhost (instead as tempo)
    3. Started spring-boot application which generates the traces & spans using Jaeger as given below 2020-11-17 16:01:21.396 INFO 15574 --- [-StreamThread-1] i.j.internal.reporters.LoggingReporter : Span reported: e5f9450a16f7dc89:e5f9450a16f7dc89:0:1 - key-selector 2020-11-17 16:01:21.401 INFO 15574 --- [-StreamThread-1] i.j.internal.reporters.LoggingReporter : Span reported: e5f9450a16f7dc89:2b5c574b5a4f0677:e5f9450a16f7dc89:1 - extract-field-for-aggregation-followed-by-groupby 2020-11-17 16:01:29.958 INFO 15574 --- [-StreamThread-1] i.j.internal.reporters.LoggingReporter : Span reported: e5f9450a16f7dc89:3ea54283e2df9fd7:2b5c574b5a4f0677:1 - perform-aggregator

    Expected behavior When I go to Tempo-Query UI to search for trace id e5f9450a16f7dc89, getting 404.

    Environment:

    • Docker images and Java client applications are running in ubuntu os (4.15.0-115-generic #116-Ubuntu)
    • Java client application (spring-boot) is a non docker application

    Additional Context The sample client application able to produce trace details in Jaeger-Query UI instead. Following arguments provided while running the client application. -Dopentracing.jaeger.udp-sender.host=localhost -Dopentracing.jaeger.udp-sender.port=6831 -Dopentracing.jaeger.const-sampler.decision=true -Dopentracing.jaeger.enabled=true -Dopentracing.jaeger.log-spans=true -Dopentracing.jaeger.service-name=xxx -Dopentracing.jaeger.http-sender.url=http://localhost:14268

  • Multitenancy does not work with non-GRPC ingestion

    Multitenancy does not work with non-GRPC ingestion

    Describe the bug failed to extract org id when auth_enabled: true

    To Reproduce Steps to reproduce the behavior:

    tempo-local.yaml

    auth_enabled: true
    
    server:
      http_listen_port: 3100
    
    distributor:
      receivers:                           # this configuration will listen on all ports and protocols that tempo is capable of.
        jaeger:                            # the receives all come from the OpenTelemetry collector.  more configuration information can
          protocols:                       # be found there: https://github.com/open-telemetry/opentelemetry-collector/tree/master/receiver
            thrift_http:                   #
            grpc:                          # for a production deployment you should only enable the receivers you need!
            thrift_binary:
            thrift_compact:
        zipkin:
        otlp:
          protocols:
            http:
            grpc:
        opencensus:
    
    ingester:
      trace_idle_period: 10s               # the length of time after a trace has not received spans to consider it complete and flush it
      #max_block_bytes: 1_000_000           # cut the head block when it hits this size or ...
      traces_per_block: 1_000_000
      max_block_duration: 5m               #   this much time passes
    
    compactor:
      compaction:
        compaction_window: 1h              # blocks in this time window will be compacted together
        max_compaction_objects: 1000000    # maximum size of compacted blocks
        block_retention: 1h
        compacted_block_retention: 10m
    
    storage:
      trace:
        backend: local                     # backend configuration to use
        wal:
          path: E:\practices\docker\tempo\tempo\wal             # where to store the the wal locally
          bloom_filter_false_positive: .05 # bloom filter false positive rate.  lower values create larger filters but fewer false positives
          index_downsample: 10             # number of traces per index record
        local:
          path: E:\practices\docker\tempo\blocks
        pool:
          max_workers: 100                 # the worker pool mainly drives querying, but is also used for polling the blocklist
          queue_depth: 10000
    
    docker run -d --rm -p 6831:6831/udp -p 9411:9411 -p 3100:3100  --name tempo -v E:\practices\docker\tempo\tempo-local.yaml:/etc/tempo-local.yaml --network docker-tempo  grafana/tempo:0.5.0 --config.file=/etc/tempo-local.yaml
    
    docker run -d --rm -p 16686:16686 -v E:\practices\docker\tempo\tempo-query.yaml:/etc/tempo-query.yaml  --network docker-tempo  grafana/tempo-query:0.5.0  --grpc-storage-plugin.configuration-file=/etc/tempo-query.yaml
    
    curl -X POST http://localhost:9411 -H 'Content-Type: application/json' -H 'X-Scope-OrgID: demo' -d '[{
     "id": "1234",
     "traceId": "0123456789abcdef",
     "timestamp": 1608239395286533,
     "duration": 100000,
     "name": "span from bash!",
     "tags": {
        "http.method": "GET",
        "http.path": "/api"
      },
      "localEndpoint": {
        "serviceName": "shell script"
      }
    }]'
    
    level=error ts=2021-01-31T07:16:33.6168738Z caller=log.go:27 msg="failed to extract org id" err="no org id"
    

    image

    Expected behavior

    Environment:

    • Infrastructure: [ Kubernetes, laptop]
    • Deployment tool: [manual and jenkins]

    Additional Context

  • Noisy error log in frontend processor -

    Noisy error log in frontend processor - "transport is closing"

    Tempo backend not ready to receive traffic even after hours

    Probably due to the following

    level=error ts=2021-01-30T15:47:14.273319231Z caller=frontend_processor.go:61 msg="error processing requests" address=127.0.0.1:9095 err="rpc error: code = Unavailable desc = transport is closing"
    

    Full Log

    level=info ts=2021-01-30T15:45:53.905814194Z caller=main.go:89 msg="Starting Tempo" version="(version=c189e23e, branch=master, revision=c189e23e)"
    --
      | level=info ts=2021-01-30T15:45:54.258823037Z caller=server.go:229 http=[::]:3100 grpc=[::]:9095 msg="server listening on addresses"
      | level=info ts=2021-01-30T15:45:54.260118522Z caller=frontend.go:24 msg="creating tripperware in query frontend to shard queries"
      | level=warn ts=2021-01-30T15:45:54.260443879Z caller=modules.go:140 msg="Worker address is empty in single binary mode.  Attempting automatic worker configuration.  If queries are unresponsive consider configuring the worker explicitly." address=127.0.0.1:9095
      | level=info ts=2021-01-30T15:45:54.26054227Z caller=worker.go:112 msg="Starting querier worker connected to query-frontend" frontend=127.0.0.1:9095
      | ts=2021-01-30T15:45:54Z level=info msg="OTel Shim Logger Initialized" component=tempo
      | level=info ts=2021-01-30T15:45:54.261646095Z caller=module_service.go:58 msg=initialising module=memberlist-kv
      | level=info ts=2021-01-30T15:45:54.261675553Z caller=module_service.go:58 msg=initialising module=overrides
      | level=info ts=2021-01-30T15:45:54.261691519Z caller=module_service.go:58 msg=initialising module=store
      | level=info ts=2021-01-30T15:45:54.26172941Z caller=module_service.go:58 msg=initialising module=server
      | level=info ts=2021-01-30T15:45:54.263537314Z caller=module_service.go:58 msg=initialising module=ring
      | level=info ts=2021-01-30T15:45:54.263580354Z caller=module_service.go:58 msg=initialising module=ingester
      | level=info ts=2021-01-30T15:45:54.26361552Z caller=module_service.go:58 msg=initialising module=compactor
      | level=info ts=2021-01-30T15:45:54.263636317Z caller=module_service.go:58 msg=initialising module=query-frontend
      | level=info ts=2021-01-30T15:45:54.26381546Z caller=module_service.go:58 msg=initialising module=querier
      | level=info ts=2021-01-30T15:45:54.263859051Z caller=module_service.go:58 msg=initialising module=distributor
      | level=info ts=2021-01-30T15:45:54.263973679Z caller=worker.go:192 msg="adding connection" addr=127.0.0.1:9095
      | level=info ts=2021-01-30T15:45:54.264012639Z caller=ingester.go:278 msg="beginning wal replay" numBlocks=0
      | level=info ts=2021-01-30T15:45:54.263814539Z caller=compactor.go:95 msg="waiting for compaction ring to settle" waitDuration=1m0s
      | level=info ts=2021-01-30T15:45:54.264449966Z caller=lifecycler.go:521 msg="not loading tokens from file, tokens file path is empty"
      | level=info ts=2021-01-30T15:45:54.26545844Z caller=client.go:242 msg="value is nil" key=collectors/ring index=1
      | level=info ts=2021-01-30T15:45:54.266328848Z caller=lifecycler.go:550 msg="instance not found in ring, adding with no tokens" ring=ingester
      | level=info ts=2021-01-30T15:45:54.266478004Z caller=lifecycler.go:397 msg="auto-joining cluster after timeout" ring=ingester
      | ts=2021-01-30T15:45:54Z level=info msg="No sampling strategies provided, using defaults" component=tempo
      | level=info ts=2021-01-30T15:45:54.267568344Z caller=app.go:212 msg="Tempo started"
      | level=info ts=2021-01-30T15:46:54.265244168Z caller=compactor.go:97 msg="enabling compaction"
      | level=info ts=2021-01-30T15:46:54.265316073Z caller=tempodb.go:278 msg="compaction and retention enabled."
      | level=error ts=2021-01-30T15:47:14.273319231Z caller=frontend_processor.go:61 msg="error processing requests" address=127.0.0.1:9095 err="rpc error: code = Unavailable desc = transport is closing"
      | level=error ts=2021-01-30T15:47:14.273303551Z caller=frontend_processor.go:61 msg="error processing requests" address=127.0.0.1:9095 err="rpc error: code = Unavailable desc = transport is closing"
      | level=error ts=2021-01-30T15:47:14.273303003Z caller=frontend_processor.go:61 msg="error processing requests" address=127.0.0.1:9095 err="rpc error: code = Unavailable desc = transport is closing"
      | level=error ts=2021-01-30T15:47:14.27332587Z caller=frontend_processor.go:61 msg="error processing requests" address=127.0.0.1:9095 err="rpc error: code = Unavailable desc = transport is closing"
      | level=error ts=2021-01-30T15:47:14.273321788Z caller=frontend_processor.go:61 msg="error processing requests" address=127.0.0.1:9095 err="rpc error: code = Unavailable desc = transport is closing"


    image

    To Reproduce Steps to reproduce the behavior:

    1. Start Tempo (grafana/tempo:latest) , as per the blog https://reachmnadeem.wordpress.com/2021/01/30/distributed-tracing-using-grafana-tempo-jaeger-with-amazon-s3-as-backend-in-openshift-kubernetes/

    Expected behavior

    Tempo backend should be ready to receive traffic

    Environment:

    • Infrastructure: [Kubernetes, Openshift]
    • Deployment tool: [Jenkins Pipeline]

    Additional Context

  • Parquet GC Crash

    Parquet GC Crash

    Describe the bug Almost every two days tempo crashes(mostly when i sleep :/)

    Environment:

    • Infrastructure: Ubuntu 22 in GCP
    • Tempo version is 9be0ae54dcf5393677b58aac3266b140289a533e

    Additional Context

    level=info ts=2022-07-21T02:46:34.415082428Z caller=compactor.go:150 msg="compacting block" block="&{Version:vParquet BlockID:04d6efdf-5d03-4b2e-ad4f-d6de785862f6 MinID:[0 0 0 0 0 0 0 0 0 19 114 70 138 122 196 128] MaxID:[255 253 55 147 253 121 118 45 44 46 196 196 224 202 84 47] TenantID:single-tenant StartTime:2022-07-21 02:41:10 +0000 UTC EndTime:2022-07-21 02:45:44 +0000 UTC TotalObjects:39445 Size:32469406 CompactionLevel:1 Encoding:none IndexPageSize:0 TotalRecords:4 DataEncoding: BloomShardCount:1 FooterSize:19866}"
    level=info ts=2022-07-21T02:46:34.415256519Z caller=compactor.go:150 msg="compacting block" block="&{Version:vParquet BlockID:0cbf760a-f00c-4e19-8638-0c222cc33c7d MinID:[0 0 0 0 0 0 0 0 0 0 72 181 216 239 229 74] MaxID:[255 254 125 251 18 105 239 112 254 110 161 216 181 72 240 92] TenantID:single-tenant StartTime:2022-07-21 02:16:09 +0000 UTC EndTime:2022-07-21 02:20:14 +0000 UTC TotalObjects:51495 Size:58062539 CompactionLevel:1 Encoding:none IndexPageSize:0 TotalRecords:6 DataEncoding: BloomShardCount:1 FooterSize:29007}"
    runtime: marked free object in span 0x7f64cb706368, elemsize=24 freeindex=0 (bad use of unsafe.Pointer? try -d=checkptr)
    0xc000410000 alloc unmarked
    0xc000410018 alloc unmarked
    0xc000410030 alloc unmarked
    0xc000410048 alloc unmarked
    0xc000410060 alloc unmarked
    0xc000410078 alloc marked
    0xc000410090 alloc unmarked
    0xc0004100a8 alloc unmarked
    0xc0004100c0 alloc marked
    0xc0004100d8 alloc unmarked
    0xc0004100f0 alloc marked
    0xc000410108 alloc unmarked
    0xc000410120 alloc unmarked
    0xc000410138 alloc marked
    0xc000410150 free  marked   zombie
    0x000000c000410150:  0x502d72656765614a  0x2e342d6e6f687479
    0x000000c000410160:  0x0000006e6f302e38
    0xc000410168 free  unmarked
    0xc000410180 free  unmarked
    0xc000410198 free  unmarked
    .....LONG OUTPUT....
    0xc000411f68 free  unmarked
    0xc000411f80 free  unmarked
    0xc000411f98 free  unmarked
    0xc000411fb0 free  unmarked
    0xc000411fc8 free  unmarked
    0xc000411fe0 free  unmarked
    fatal error: found pointer to free object
    
    goroutine 4067 [running]:
    runtime.throw({0x1ffd4d0?, 0xc000410168?})
            /usr/local/go/src/runtime/panic.go:992 +0x71 fp=0xc00cc0b728 sp=0xc00cc0b6f8 pc=0x438731
    runtime.(*mspan).reportZombies(0x7f64cb706368)
            /usr/local/go/src/runtime/mgcsweep.go:776 +0x2e5 fp=0xc00cc0b7a8 sp=0xc00cc0b728 pc=0x427305
    runtime.(*sweepLocked).sweep(0x357bca0?, 0x0)
            /usr/local/go/src/runtime/mgcsweep.go:609 +0x8b2 fp=0xc00cc0b880 sp=0xc00cc0b7a8 pc=0x426d12
    runtime.sweepone()
            /usr/local/go/src/runtime/mgcsweep.go:369 +0xf0 fp=0xc00cc0b8d0 sp=0xc00cc0b880 pc=0x426190
    runtime.GC()
            /usr/local/go/src/runtime/mgc.go:451 +0x7e fp=0xc00cc0b908 sp=0xc00cc0b8d0 pc=0x41bc3e
    github.com/grafana/tempo/tempodb/encoding/vparquet.(*Compactor).Compact(0xc0090ecb00, {0x24e8318, 0xc0000500a0}, {0x24d1360, 0xc00001b360}, {0x24f4540, 0xc0009da830}, 0xc01c74fdc0, {0xc01c74fca0, 0x2, ...})
            /root/tempo/repo/tempo/tempodb/encoding/vparquet/compactor.go:105 +0x7f6 fp=0xc00cc0bb50 sp=0xc00cc0b908 pc=0x1340036
    github.com/grafana/tempo/tempodb.(*readerWriter).compact(0xc0009c6840, {0xc01c74fca0?, 0x2, 0x2}, {0xc0003ec013, 0xd})
            /root/tempo/repo/tempo/tempodb/compactor.go:189 +0x889 fp=0xc00cc0bdc8 sp=0xc00cc0bb50 pc=0x1794ca9
    github.com/grafana/tempo/tempodb.(*readerWriter).doCompaction(0xc0009c6840)
            /root/tempo/repo/tempo/tempodb/compactor.go:113 +0x4fb fp=0xc00cc0bf88 sp=0xc00cc0bdc8 pc=0x1793b1b
    github.com/grafana/tempo/tempodb.(*readerWriter).compactionLoop(0xc0009c6840)
            /root/tempo/repo/tempo/tempodb/compactor.go:72 +0x77 fp=0xc00cc0bfc8 sp=0xc00cc0bf88 pc=0x17935d7
    github.com/grafana/tempo/tempodb.(*readerWriter).EnableCompaction.func1()
            /root/tempo/repo/tempo/tempodb/tempodb.go:385 +0x26 fp=0xc00cc0bfe0 sp=0xc00cc0bfc8 pc=0x1799b26
    runtime.goexit()
            /usr/local/go/src/runtime/asm_amd64.s:1571 +0x1 fp=0xc00cc0bfe8 sp=0xc00cc0bfe0 pc=0x46bac1
    created by github.com/grafana/tempo/tempodb.(*readerWriter).EnableCompaction
            /root/tempo/repo/tempo/tempodb/tempodb.go:385 +0x1c5
    
    
  • python otel jaeger exporter,tempo query not data

    python otel jaeger exporter,tempo query not data

    python opentelemetry instrument install

    pip install opentelemetry-sdk
    pip install opentelemetry-distro
    pip install opentelemetry-exporter-jaeger-proto-grpc
    

    Testing python scripts:

    import time
    
    from opentelemetry import trace
    from opentelemetry.exporter.jaeger.proto import grpc
    from opentelemetry.sdk.trace import TracerProvider
    from opentelemetry.sdk.trace.export import (BatchSpanProcessor,ConsoleSpanExporter)
    from opentelemetry.sdk.resources import SERVICE_NAME, Resource
    
    trace.set_tracer_provider(TracerProvider(
        resource=Resource.create({SERVICE_NAME: "my-helloworld-service"})
        ))
    tracer = trace.get_tracer(__name__)
    
    # Create a JaegerExporter to send spans with gRPC
    # If there is no encryption or authentication set `insecure` to True
    # If server has authentication with SSL/TLS you can set the
    # parameter credentials=ChannelCredentials(...) or the environment variable
    # `EXPORTER_JAEGER_CERTIFICATE` with file containing creds.
    
    jaeger_exporter = grpc.JaegerExporter(
        collector_endpoint="localhost:14250",
        insecure=True,
    )
    
    trace.get_tracer_provider().add_span_processor(
        BatchSpanProcessor(ConsoleSpanExporter())
    )
    
    trace.get_tracer_provider().add_span_processor(
            BatchSpanProcessor(jaeger_exporter)
            )
    
    # create some spans for testing
    with tracer.start_as_current_span("foo") as foo:
        time.sleep(0.1)
        foo.set_attribute("my_atribbute", True)
        foo.add_event("event in foo", {"name": "foo1"})
        with tracer.start_as_current_span(
            "bar", links=[trace.Link(foo.get_span_context())]
        ) as bar:
            time.sleep(0.2)
            bar.set_attribute("speed", 100.0)
    
            with tracer.start_as_current_span("baz") as baz:
                time.sleep(0.3)
                baz.set_attribute("name", "mauricio")
    
            time.sleep(0.2)
    
        time.sleep(0.1)
    

    Exporting to Jaeger is normal and can be queried image

    Exports to Tempo cannot be queried,There was no hint image

    grafana tempo query result data:

    {
        "results": {
            "B": {
                "frames": [
                    {
                        "schema": {
                            "name": "Trace",
                            "refId": "B",
                            "meta": {
                                "preferredVisualisationType": "trace"
                            },
                            "fields": [
                                {
                                    "name": "traceID",
                                    "type": "string",
                                    "typeInfo": {
                                        "frame": "string"
                                    }
                                },
                                {
                                    "name": "spanID",
                                    "type": "string",
                                    "typeInfo": {
                                        "frame": "string"
                                    }
                                },
                                {
                                    "name": "parentSpanID",
                                    "type": "string",
                                    "typeInfo": {
                                        "frame": "string"
                                    }
                                },
                                {
                                    "name": "operationName",
                                    "type": "string",
                                    "typeInfo": {
                                        "frame": "string"
                                    }
                                },
                                {
                                    "name": "serviceName",
                                    "type": "string",
                                    "typeInfo": {
                                        "frame": "string"
                                    }
                                },
                                {
                                    "name": "serviceTags",
                                    "type": "string",
                                    "typeInfo": {
                                        "frame": "string"
                                    }
                                },
                                {
                                    "name": "startTime",
                                    "type": "number",
                                    "typeInfo": {
                                        "frame": "float64"
                                    }
                                },
                                {
                                    "name": "duration",
                                    "type": "number",
                                    "typeInfo": {
                                        "frame": "float64"
                                    }
                                },
                                {
                                    "name": "logs",
                                    "type": "string",
                                    "typeInfo": {
                                        "frame": "string"
                                    }
                                },
                                {
                                    "name": "references",
                                    "type": "string",
                                    "typeInfo": {
                                        "frame": "string"
                                    }
                                },
                                {
                                    "name": "tags",
                                    "type": "string",
                                    "typeInfo": {
                                        "frame": "string"
                                    }
                                }
                            ]
                        },
                        "data": {
                            "values": [
                                [],
                                [],
                                [],
                                [],
                                [],
                                [],
                                [],
                                [],
                                [],
                                [],
                                []
                            ]
                        }
                    }
                ]
            }
        }
    }
    
  • Unhealthy compactors do not leave the ring after rollout

    Unhealthy compactors do not leave the ring after rollout

    Describe the bug When rolling out a new deployment of the compactors, some old instances will remain in the ring as Unhealthy. The only fix seems to be to port-forward one of the compactors and use the /compactor/ring page to "Forget" all the unhealthy instances.

    To Reproduce Steps to reproduce the behavior:

    1. Start Tempo in kubernetes (we have tried the 1.1 release but the issue persists with af34e132a1b8)
    2. Perform a rollout of the compactors

    Expected behavior The compactors from the previous deployment leave the ring correctly

    Environment:

    • Infrastructure: kubernetes
    • Deployment tool: kubectl apply

    Additional Context We do not see this happen all the time. On one of our similarly sized but less busy clusters, old compactors rarely stay in the ring after a rollout. On the busier cluster, we had 14 unhealthy compactors from a previous deployment still in the ring, out of 30 in the deployment.

    Our tempo config for memberlist:

    memberlist:
          abort_if_cluster_join_fails: false
          join_members:
            - tempo-gossip-ring
          dead_node_reclaim_time: 15s
          bind_addr: ["${POD_IP}"]
    

    Sample logs from a compactor that stayed in the ring as unhealthy, from the moment where shutdown was requested:

    level=info ts=2021-10-26T15:26:54.628754652Z caller=signals.go:55 msg=""=== received SIGINT/SIGTERM ===\n*** exiting""level=info ts=2021-10-26T15:26:54.629120545Z caller=lifecycler.go:457 msg=""lifecycler loop() exited gracefully"" ring=compactor
    level=info ts=2021-10-26T15:26:54.629162701Z caller=lifecycler.go:768 msg=""changing instance state from"" old_state=ACTIVE new_state=LEAVING ring=compactor
    level=info ts=2021-10-26T15:26:55.632049563Z caller=lifecycler.go:509 msg=""instance removed from the KV store"" ring=compactor
    level=info ts=2021-10-26T15:26:55.63212068Z caller=module_service.go:96 msg=""module stopped"" module=compactor
    level=info ts=2021-10-26T15:26:55.632206675Z caller=module_service.go:96 msg=""module stopped"" module=overrides
    level=info ts=2021-10-26T15:26:55.632206876Z caller=memberlist_client.go:572 msg=""leaving memberlist cluster""
    level=info ts=2021-10-26T15:26:55.632249778Z caller=module_service.go:96 msg=""module stopped"" module=store
    level=warn ts=2021-10-26T15:27:05.735678769Z caller=memberlist_client.go:587 msg=""broadcast messages left in queue"" count=16 nodes=146
    level=info ts=2021-10-26T15:27:07.192768676Z caller=module_service.go:96 msg=""module stopped"" module=memberlist-kv
    level=info ts=2021-10-26T15:27:07.194383366Z caller=server_service.go:50 msg=""server stopped""
    level=info ts=2021-10-26T15:27:07.194466883Z caller=module_service.go:96 msg=""module stopped"" module=server
    level=info ts=2021-10-26T15:27:07.19452497Z caller=app.go:271 msg=""Tempo stopped""
    level=info ts=2021-10-26T15:27:07.194539895Z caller=main.go:135 msg=""Tempo running""
    

    I was confused by that last Tempo running line but looking at the code in main.go, this seems normal.

  • Errors form distributor

    Errors form distributor "context deadline exceeded"

    Describe the bug I have a lot of dropped traces. Errors form distributors

    level=error ts=2022-08-08T12:54:50.237305922Z caller=rate_limited_logger.go:27 msg="pusher failed to consume trace data" err="context deadline exceeded"
    level=error ts=2022-08-08T12:55:01.377532608Z caller=rate_limited_logger.go:27 msg="pusher failed to consume trace data" err="context canceled"
    level=error ts=2022-08-08T12:55:20.983607767Z caller=rate_limited_logger.go:27 msg="pusher failed to consume trace data" err="context deadline exceeded"
    level=error ts=2022-08-08T12:55:34.83259462Z caller=rate_limited_logger.go:27 msg="pusher failed to consume trace data" err="context deadline exceeded"
    level=error ts=2022-08-08T12:55:38.333709329Z caller=rate_limited_logger.go:27 msg="pusher failed to consume trace data" err="context deadline exceeded"
    level=error ts=2022-08-08T12:55:41.23312395Z caller=rate_limited_logger.go:27 msg="pusher failed to consume trace data" err="context canceled"
    level=error ts=2022-08-08T12:55:44.841565822Z caller=rate_limited_logger.go:27 msg="pusher failed to consume trace data" err="context canceled"
    level=error ts=2022-08-08T12:56:01.016239081Z caller=rate_limited_logger.go:27 msg="pusher failed to consume trace data" err="context canceled"
    

    To Reproduce Steps to reproduce the behaviour:

    1. Start Tempo from helm chart tempo-distributed 0.20.3 and Grafana agent 0.25.1
    2. Perform Operations (Write)

    Tempo configuration

    multitenancy_enabled: false
    search_enabled: true
    compactor:
      compaction:
        block_retention: 700h
        iterator_buffer_size: 800
      ring:
        kvstore:
          store: memberlist
    distributor:
      ring:
        kvstore:
          store: memberlist
      receivers:
        jaeger:
          protocols:
            grpc:
              endpoint: 0.0.0.0:14250
            thrift_http:
              endpoint: 0.0.0.0:14268
    querier:
      frontend_worker:
        frontend_address: tempo-query-frontend-discovery:9095
    ingester:
      trace_idle_period: 1m
      lifecycler:
        ring:
          replication_factor: 2
          kvstore:
            store: memberlist
        tokens_file_path: /var/tempo/tokens.json
    memberlist:
      abort_if_cluster_join_fails: false
      join_members:
        - tempo-gossip-ring
    overrides:
      max_search_bytes_per_trace: 0
      ingestion_burst_size_bytes: 60000000
      ingestion_rate_limit_bytes: 50000000
      max_bytes_per_trace: 9000000
    server:
      http_listen_port: 3100
      log_level: info
      log_format: logfmt
      grpc_server_max_recv_msg_size: 4194304
      grpc_server_max_send_msg_size: 4194304
    storage:
      trace:
        backend: s3
        s3:
          bucket: m2-tempo-prod
          region: us-central1
          access_key: ******
          secret_key: ******
        blocklist_poll: 5m
        local:
          path: /var/tempo/traces
        wal:
          path: /var/tempo/wal
        cache: memcached
        memcached:
          consistent_hash: true
          host: tempo-memcached
          service: memcached-client
          timeout: 500ms
    metrics_generator:
      ring:
        kvstore:
          store: memberlist
      storage:
        path: /var/tempo/wal
    

    ** Grafana agent remote write **

    traces:
          configs:
            - name: jaeger
              receivers:
                ...
              batch:
                send_batch_size: 8192
                timeout: 20s
              remote_write:
                - endpoint: tempo-distributor.observability.svc.cluster.local:14250
                  insecure: true
                  insecure_skip_verify: true
                  protocol: grpc
                  format: jaeger
                  sending_queue:
                    queue_size: 5000
                  retry_on_failure:
                    max_elapsed_time: 30s
    

    Expected behaviour Distributors don't drop traces

    Environment:

    • Infrastructure: Kubernetes
    • Deployment tool: helm

    Additional Context Metric tempo_discarded_spans_total

    tempo_discarded_spans_total{container="distributor", endpoint="http", instance="10.107.156.36:3100", job="tempo-distributor", namespace="observability", pod="tempo-distributor-75db5b54cb-k6tl2", reason="internal_error", service="tempo-distributor", tenant="single-tenant"}
    
  • Bump github.com/thanos-io/thanos from 0.24.0 to 0.27.0

    Bump github.com/thanos-io/thanos from 0.24.0 to 0.27.0

    Bumps github.com/thanos-io/thanos from 0.24.0 to 0.27.0.

    Release notes

    Sourced from github.com/thanos-io/thanos's releases.

    v0.27.0

    What's Changed

    Fixed

    • #5339 Receive: When running in routerOnly mode, an interupt (SIGINT) will now exit the process.
    • #5357 Store: Fix groupcache handling by making sure slashes in the cache's key are not getting interpreted by the router anymore.
    • #5427 Receive: Fix Ketama hashring replication consistency. With the Ketama hashring, replication is currently handled by choosing subsequent nodes in the list of endpoints. This can lead to existing nodes getting more series when the hashring is scaled. This change makes replication to choose subsequent nodes from the hashring which should not create new series in old nodes when the hashring is scaled. Ketama hashring can be used by setting --receive.hashrings-algorithm=ketama.

    Added

    • #5337 Thanos Object Store: Add the prefix option to buckets.
    • #5409 S3: Add option to force DNS style lookup.
    • #5352 Cache: Add cache metrics to groupcache: thanos_cache_groupcache_bytes, thanos_cache_groupcache_evictions_total, thanos_cache_groupcache_items and thanos_cache_groupcache_max_bytes.
    • #5391 Receive: Add relabeling support with the flag --receive.relabel-config-file or alternatively --receive.relabel-config.
    • #5408 Receive: Add support for consistent hashrings. The flag --receive.hashrings-algorithm uses default hashmod but can also be set to ketama to leverage consistent hashrings. More technical information can be found here: https://dgryski.medium.com/consistent-hashing-algorithmic-tradeoffs-ef6b8e2fcae8.
    • #5402 Receive: Implement api/v1/status/tsdb.

    Changed

    New Contributors

    Full Changelog: https://github.com/thanos-io/thanos/compare/v0.26.0...v0.27.0

    v0.27.0-rc.0

    What's Changed

    Fixed

    • #5339 Receive: When running in routerOnly mode, an interupt (SIGINT) will now exit the process.
    • #5357 Store: Fix groupcache handling by making sure slashes in the cache's key are not getting interpreted by the router anymore.
    • #5427 Receive: Fix Ketama hashring replication consistency. With the Ketama hashring, replication is currently handled by choosing subsequent nodes in the list of endpoints. This can lead to existing nodes getting more series when the hashring is scaled. This change makes replication to choose subsequent nodes from the hashring which should not create new series in old nodes when the hashring is scaled. Ketama hashring can be used by setting --receive.hashrings-algorithm=ketama

    Added

    • #5337 Thanos Object Store: Add the prefix option to buckets.

    ... (truncated)

    Changelog

    Sourced from github.com/thanos-io/thanos's changelog.

    v0.27.0 - 2022.07.05

    Fixed

    • #5339 Receive: Fix deadlock on interrupt in routerOnly mode.
    • #5357 Store: fix groupcache handling of slashes.
    • #5427 Receive: Fix Ketama hashring replication consistency.

    Added

    • #5337 Thanos Object Store: Add the prefix option to buckets.
    • #5409 S3: Add option to force DNS style lookup.
    • #5352 Cache: Add cache metrics to groupcache.
    • #5391 Receive: Add relabeling support.
    • #5408 Receive: Add support for consistent hashrings.
    • #5391 Receive: Implement api/v1/status/tsdb.

    Changed

    Removed

    • #5426 Compactor: Remove an unused flag --block-sync-concurrency.

    v0.26.0 - 2022.05.05

    Fixed

    • #5281 Blocks: Use correct separators for filesystem paths and object storage paths respectively.
    • #5300 Query: Ignore cache on queries with deduplication off.
    • #5324 Reloader: Force trigger reload when config rollbacked.

    Added

    • #5220 Query Frontend: Add --query-frontend.forward-header flag, forward headers to downstream querier.
    • #5250 Querier: Expose Query and QueryRange APIs through GRPC.
    • #5290 Add support for ppc64le.

    Changed

    • #4838 Tracing: Chanced client for Stackdriver which deprecated "type: STACKDRIVER" in tracing YAML configuration. Use type: GOOGLE_CLOUD instead (STACKDRIVER type remains for backward compatibility).
    • #5170 All: Upgraded the TLS version from TLS1.2 to TLS1.3.
    • #5205 Rule: Add ruler labels as external labels in stateless ruler mode.
    • #5206 Cache: Add timeout for groupcache's fetch operation.
    • #5218 Tools: Thanos tools bucket downsample is now running continously.
    • #5231 Tools: Bucket verify tool ignores blocks with deletion markers.
    • #5244 Query: Promote negative offset and @ modifier to stable features as per Prometheus #10121.
    • #5255 InfoAPI: Set store API unavailable when stores are not ready.
    • #5256 Update Prometheus deps v2.33.5.
    • #5271 DNS: Fix miekgdns resolver to work with CNAME records too.

    ... (truncated)

    Commits

    Dependabot compatibility score

    Dependabot will resolve any conflicts with this PR as long as you don't alter it yourself. You can also trigger a rebase manually by commenting @dependabot rebase.


    Dependabot commands and options

    You can trigger Dependabot actions by commenting on this PR:

    • @dependabot rebase will rebase this PR
    • @dependabot recreate will recreate this PR, overwriting any edits that have been made to it
    • @dependabot merge will merge this PR after your CI passes on it
    • @dependabot squash and merge will squash and merge this PR after your CI passes on it
    • @dependabot cancel merge will cancel a previously requested merge and block automerging
    • @dependabot reopen will reopen this PR if it is closed
    • @dependabot close will close this PR and stop Dependabot recreating it. You can achieve the same result by closing it manually
    • @dependabot ignore this major version will close this PR and stop Dependabot creating any more for this major version (unless you reopen the PR or upgrade to it yourself)
    • @dependabot ignore this minor version will close this PR and stop Dependabot creating any more for this minor version (unless you reopen the PR or upgrade to it yourself)
    • @dependabot ignore this dependency will close this PR and stop Dependabot creating any more for this dependency (unless you reopen the PR or upgrade to it yourself)
  • Added note about distributed binaries

    Added note about distributed binaries

    What this PR does:

    This PR adds a brief paragraph to the Linux single binary set up page. This paragraph informs readers that they can also use the single binary in distributed mode.

    Checklist

    • [ ] Tests updated
    • [X] Documentation added
    • [ ] CHANGELOG.md updated - the order of entries should be [CHANGE], [FEATURE], [ENHANCEMENT], [BUGFIX]
  • Tempo 2.0: Config Cleanup

    Tempo 2.0: Config Cleanup

    What this PR does: This is a config cleanup pass to prepare for 2.0. The following changes were made to config:

    Defaults Updated Settings listed with new defaults. These defaults were changed to work better with the new Parquet backend.

    query_frontend:
        max_oustanding_per_tenant: 2000
        search:
            concurrent_jobs: 1000
            target_bytes_per_job: 104857600
            max_duration: 168h
            query_ingesters_until: 30m
        trace_by_id:
            query_shards: 50
    querier:
        max_concurrent_queries: 20
        search:
            prefer_self: 10
    ingester:
        concurrent_flushes: 4
        max_block_duration: 30m
        max_block_bytes: 524288000
    storage:
        trace:
            pool:
                max_workers: 400
                queue_depth: 20000
            search:
                read_buffer_count: 32
                read_buffer_size_bytes: 1048576
    

    Renamed/Moved/Removed Config

    query_frontend:
        query_shards: // removed. use trace_by_id.query_shards
    querier:
        query_timeout: // removed. use trace_by_id.query_timeout
    compactor:
        compaction:
            chunk_size_bytes:   // renamed to v2_in_buffer_bytes
            flush_size_bytes:     // renamed to v2_out_buffer_bytes
            iterator_buffer_size: // renamed to v2_prefetch_traces_count
    ingester:
        use_flatbuffer_search:   // removed. automatically set based on block type
    storage:
        wal:
            encoding:  // renamed to v2_encoding
            version:     // removed and pinned to block.version
        block:
            index_downsample_bytes:  // renamed to v2_index_downsample_bytes
            index_page_size_bytes:      // renamed to v2_index_page_size_bytes
            encoding:                  	    // renamed to v2_encoding
            row_group_size_bytes:       // renamed to parquet_row_group_size_bytes
    

    As part of the removing useFlatBufferSearch and requiring the wal and block Version to be the same the tests in ./modules/ingester had to be heavily reworked. This is b/c they were written for flatbuffer/v2 wal and they have now been updated to use the current block type for the wal (vparquet). During this process the following bugs were found and corrected:

    • SearchTags/TagValues was not working on the parquet headblock/completing blocks
    • When replaying a parquet wal block we were double counting total objects

    Finally, I would still like to remove search_enabled and metrics_generator_enabled but I intend to do that in a future PR as this has gotten quite large.

    Checklist

    • [x] Tests updated
    • [ ] Documentation added
    • [x] CHANGELOG.md updated - the order of entries should be [CHANGE], [FEATURE], [ENHANCEMENT], [BUGFIX]
  • list all operations for a given service

    list all operations for a given service

    Is your feature request related to a problem? Please describe. tried using Grafana Tempo console, and found span.name is not changed after selecting a service name. All span.name in the system are listed no matter what service gets selected.

    from the network console, it shows the request is /api/search/tag/name/values without any other parameter like service.name=xxx.

    Describe the solution you'd like When using Jaeger, the listed operations are only for the selected service. It helps end users. When the number of service is more than thousand, it's impossible to find the given operation.

    Describe alternatives you've considered enhance API https://grafana.com/docs/tempo/latest/api_docs/#search-tag-values to allow filter by service.

    Additional context image

  • Add Snyk Scanning workflow

    Add Snyk Scanning workflow

    Hello, this PR adds a workflow to automate code scanning via Snyk. The Grafana Labs Security Engineering manages a Snyk tennent which will ingest these results. Adding this workflow will allow our Snyk Dashboards to be updated on every release and merge to the 'main' branch. If you have any questions, please reach out to '@security-team' or '#security-engineering'

    Created by Sourcegraph batch change ethan.smith/snyk-monitor-workflow.

  • Collect inspectedBytes from SearchMetrics

    Collect inspectedBytes from SearchMetrics

    What this PR does:

    Which issue(s) this PR fixes: Fixes #

    Checklist

    • [ ] Tests updated
    • [ ] Documentation added
    • [ ] CHANGELOG.md updated - the order of entries should be [CHANGE], [FEATURE], [ENHANCEMENT], [BUGFIX]
  • Derived metrics are missing HELP documentation

    Derived metrics are missing HELP documentation

    Describe the bug We're using the Metrics Generator But the metrics generated have no HELP text or metadata associated with them in Grafana-Cloud Prometheus datasource:

    From @danielkenlee

    I was exploring some trace metrics in the metrics browser today on a customer instance and noticed the help documentation doesn't seem to be loading into the metrics data source for Tempo Metrics Generator metrics. See example for traces_spanmetrics_size_total - here I might expect some details about dimensions (kb, Mbs etc.) Upon hovering over traces_spanmetrics_size_total the popup simply repeats the metric name. Is this behaviour intended? Should help text appear here?

    traces_screenshot

    To Reproduce

    Use the metrics generator as per: https://grafana.com/blog/2022/05/02/new-in-grafana-tempo-1.4-introducing-the-metrics-generator/

    Then try to access the metadata for the derived metrics, and see that it is missing.

    Expected behavior In the Metrics Browser, when I hover the metric name for a Temp Derived metric, the HELP text should be available

    Environment:

    • Infrastructure: GrafanaCloud

    Additional Context None

grafana-sync Keep your grafana dashboards in sync.

grafana-sync Keep your grafana dashboards in sync. Table of Contents grafana-sync Table of Contents Installing Getting Started Pull Save all dashboard

Dec 14, 2022
Snowflake grafana datasource plugin allows Snowflake data to be visually represented in Grafana dashboards.

Snowflake Grafana Data Source With the Snowflake plugin, you can visualize your Snowflake data in Grafana and build awesome chart. Get started with th

Dec 29, 2022
Terraform-grafana-dashboard - Grafana dashboard Terraform module

terraform-grafana-dashboard terraform-grafana-dashboard for project Requirements

May 2, 2022
Grafana-threema-forwarder - Alert forwarder from Grafana webhooks to Threema wire messages

Grafana to Threema alert forwarder Although Grafana has built in support for pus

Nov 11, 2022
Grafana DB2 Data Source Backend Plugin

Grafana DB2 Data Source Backend Plugin This template is a starting point for building Grafana Data Source Backend Plugins What is Grafana Data Source

Dec 13, 2021
Grafana Data Source Backend Plugin Template

Grafana Data Source Backend Plugin Template This template is a starting point for building Grafana Data Source Backend Plugins What is Grafana Data So

Jan 16, 2022
Grafana Data Source Backend Plugin

Grafana Data Source Backend Plugin This plugin allows you to receive telemetry i

Sep 18, 2022
Topology-tester - Application to easily test microservice topologies and distributed tracing including K8s and Istio

Topology Tester The Topology Tester app allows you to quickly build a dynamic mi

Jan 14, 2022
K8s-cinder-csi-plugin - K8s Pod Use Openstack Cinder Volume

k8s-cinder-csi-plugin K8s Pod Use Openstack Cinder Volume openstack volume list

Jul 18, 2022
Small monitor of pulseaudio volume etc. for use in xmobar, as CommandReader input

Simple PulseAudio volume monitor for xmobar This little monitor is my attempt to read the current volume and mute setting of the default sink from Pul

Feb 16, 2022
Local Storage is one of HwameiStor components. It will provision the local LVM volume.

Local Storage Module English | Simplified_Chinese Introduction Local Storage is one of modules of HwameiStor which is a cloud native local storage sys

Aug 6, 2022
Taina backend Backend service With Golang

taina-backend Backend service Getting Started Essential steps to get your backend service deployed A helloworld example has been shipped with the temp

Nov 17, 2021
Acropolis Backend is the Go backend for Acropolis - the central management system for Full Stack at Brown

Acropolis Backend Acropolis Backend is the Go backend for Acropolis — the centra

Dec 25, 2021
Go-backend-test - Creating backend stuff & openid connect authentication stuff in golang

Go Backend Coding Practice This is my practice repo to learn about creating back

Feb 5, 2022
Oct 7, 2022
Automatic manual tracing :)

autotel Automatic manual tracing :) The aim of this project is to show how golang can be used to automatically inject open telemetry tracing (https://

Nov 7, 2022
Grafana Dashboard Manager

Grafana dash-n-grab Grafana Dash-n-Grab (GDG) -- Dashboard/DataSource Manager. The purpose of this project is to provide an easy to use CLI to interac

Dec 31, 2022
Graph and alert on '.rrd' data using grafana, RRDTool and RRDSrv.

Grafana RRD Datasource A grafana datasource for reading '.rrd' files via RRDTool and RRDsrv. With this datasource you will be able to create grafana d

Oct 12, 2022
Download your Fitbit weight history and connect to InfluxDB and Grafana

WemonFit Weight monitoring for Fitbit, using InfluxDB and Grafana Generating a new certificate openssl req -new -newkey rsa:2048 -nodes -keyout lo

Oct 22, 2022