Grabana
![]()

Grabana provides a developer-friendly way of creating Grafana dashboards.
Whether you prefer writing code or YAML, if you are looking for a way to version your dashboards configuration or automate tedious and error-prone creation of dashboards, this library is meant for you.
Design goals
- provide an understandable abstraction over dashboards configuration
- expose a developer-friendly API
- allow IDE assistance and auto-completion
Dashboard as code
Dashboard configuration:
builder := dashboard.New(
"Awesome dashboard",
dashboard.AutoRefresh("5s"),
dashboard.Tags([]string{"generated"}),
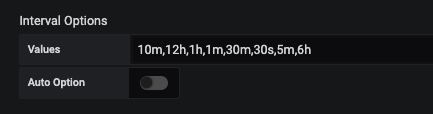
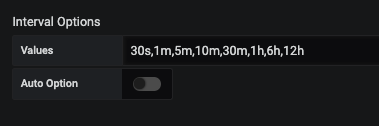
dashboard.VariableAsInterval(
"interval",
interval.Values([]string{"30s", "1m", "5m", "10m", "30m", "1h", "6h", "12h"}),
),
dashboard.Row(
"Prometheus",
row.WithGraph(
"HTTP Rate",
graph.DataSource("prometheus-default"),
graph.WithPrometheusTarget(
"rate(prometheus_http_requests_total[30s])",
prometheus.Legend("{{handler}} - {{ code }}"),
),
),
),
)
Dashboard creation:
ctx := context.Background()
client := grabana.NewClient(&http.Client{}, grafanaHost, grabana.WithAPIToken("such secret, much wow"))

// create the folder holding the dashboard for the service
folder, err := client.FindOrCreateFolder(ctx, "Test Folder")
if err != nil {
    fmt.Printf("Could not find or create folder: %s\n", err)
    os.Exit(1)
}

if _, err := client.UpsertDashboard(ctx, folder, builder); err != nil {
    fmt.Printf("Could not create dashboard: %s\n", err)
    os.Exit(1)
}
For a more complete example, see the example directory.
Dashboard as YAML
Dashboard configuration:
# dashboard.yaml
title: Awesome dashboard

editable: true
tags: [generated]
auto_refresh: 5s

variables:
  - interval:
      name: interval
      label: Interval
      values: ["30s", "1m", "5m", "10m", "30m", "1h", "6h", "12h"]

rows:
  - name: Prometheus
    panels:
      - graph:
          title: HTTP Rate
          height: 400px
          datasource: prometheus-default
          targets:
            - prometheus:
                query: "rate(promhttp_metric_handler_requests_total[$interval])"
                legend: "{{handler}} - {{ code }}"
Dashboard creation (or automatically as a Kubernetes Resource, using DARK):
content, err := ioutil.ReadFile("dashboard.yaml")
if err != nil {
    fmt.Fprintf(os.Stderr, "Could not read file: %s\n", err)
    os.Exit(1)
}

dashboard, err := decoder.UnmarshalYAML(bytes.NewBuffer(content))
if err != nil {
    fmt.Fprintf(os.Stderr, "Could not parse file: %s\n", err)
    os.Exit(1)
}

ctx := context.Background()
client := grabana.NewClient(&http.Client{}, grafanaHost, grabana.WithAPIToken("such secret, much wow"))

// create the folder holding the dashboard for the service
folder, err := client.FindOrCreateFolder(ctx, "Test Folder")
if err != nil {
    fmt.Printf("Could not find or create folder: %s\n", err)
    os.Exit(1)
}

if _, err := client.UpsertDashboard(ctx, folder, dashboard); err != nil {
    fmt.Printf("Could not create dashboard: %s\n", err)
    os.Exit(1)
}
Going further
Check out the documentation to discover what Grabana can do for you.
License
This library is under the MIT license.


![[Add] GetDashboardByTitle](https://avatars.githubusercontent.com/u/30858198?v=4)


