![]()
![]()
VictoriaMetrics
VictoriaMetrics is a fast, cost-effective and scalable monitoring solution and time series database.
It is available in binary releases, docker images, Snap package and in source code. Just download VictoriaMetrics and see how to start it. If you use Ubuntu, then just run snap install victoriametrics in order to install and run it. Then read Prometheus setup and Grafana setup docs.
Cluster version is available here.
See additional docs at our Wiki.
Contact us if you need paid enterprise support for VictoriaMetrics. See features available for enterprise customers.
Case studies and talks
Alphabetically sorted links to case studies:
- adidas
- Adsterra
- ARNES
- Brandwatch
- CERN
- COLOPL
- Dreamteam
- Idealo.de
- MHI Vestas Offshore Wind
- Synthesio
- Wedos.com
- Wix.com
- Zerodha
- zhihu
Prominent features
- VictoriaMetrics can be used as long-term storage for Prometheus or for vmagent. See these docs for details.
- VictoriaMetrics supports Prometheus querying API, so it can be used as Prometheus drop-in replacement in Grafana.
- VictoriaMetrics implements MetricsQL query language backwards compatible with PromQL.
- VictoriaMetrics provides global query view. Multiple Prometheus instances or any other data sources may ingest data into VictoriaMetrics. Later this data may be queried via a single query.
- High performance and good scalability for both inserts and selects. Outperforms InfluxDB and TimescaleDB by up to 20x.
- Uses 10x less RAM than InfluxDB and up to 7x less RAM than Prometheus, Thanos or Cortex when dealing with millions of unique time series (aka high cardinality).
- Optimized for time series with high churn rate. Think about prometheus-operator metrics from frequent deployments in Kubernetes.
- High data compression, so up to 70x more data points may be crammed into limited storage comparing to TimescaleDB and up to 7x less storage space is required comparing to Prometheus, Thanos or Cortex.
- Optimized for storage with high-latency IO and low IOPS (HDD and network storage in AWS, Google Cloud, Microsoft Azure, etc). See graphs from these benchmarks.
- A single-node VictoriaMetrics may substitute moderately sized clusters built with competing solutions such as Thanos, M3DB, Cortex, InfluxDB or TimescaleDB. See vertical scalability benchmarks, comparing Thanos to VictoriaMetrics cluster and Remote Write Storage Wars talk from PromCon 2019.
- Easy operation:
- VictoriaMetrics consists of a single small executable without external dependencies.
- All the configuration is done via explicit command-line flags with reasonable defaults.
- All the data is stored in a single directory pointed by
-storageDataPathcommand-line flag. - Easy and fast backups from instant snapshots to S3 or GCS with vmbackup / vmrestore. See this article for more details.
- Storage is protected from corruption on unclean shutdown (i.e. OOM, hardware reset or
kill -9) thanks to the storage architecture. - Supports metrics' scraping, ingestion and backfilling via the following protocols:
- Metrics from Prometheus exporters such as node_exporter. See these docs for details.
- Prometheus remote write API
- InfluxDB line protocol over HTTP, TCP and UDP.
- Graphite plaintext protocol with tags if
-graphiteListenAddris set. - OpenTSDB put message if
-opentsdbListenAddris set. - HTTP OpenTSDB /api/put requests if
-opentsdbHTTPListenAddris set. - JSON line format.
- Native binary format.
- Prometheus exposition format.
- Arbitrary CSV data.
- Supports metrics' relabeling. See these docs for details.
- Ideally works with big amounts of time series data from Kubernetes, IoT sensors, connected cars, industrial telemetry, financial data and various Enterprise workloads.
- Has open source cluster version.
- See also technical Articles about VictoriaMetrics.
Operation
Table of contents
- How to start VictoriaMetrics
- Prometheus setup
- Grafana setup
- How to upgrade VictoriaMetrics
- How to apply new config to VictoriaMetrics
- How to scrape Prometheus exporters such as node_exporter
- How to send data from InfluxDB-compatible agents such as Telegraf
- How to send data from Graphite-compatible agents such as StatsD
- Querying Graphite data
- How to send data from OpenTSDB-compatible agents
- Prometheus querying API usage
- Graphite API usage
- How to build from sources
- Start with docker-compose
- Setting up service
- How to work with snapshots
- How to delete time series
- Forced merge
- How to export time series
- How to import time series data
- Relabeling
- Federation
- Capacity planning
- High availability
- Deduplication
- Retention
- Multiple retentions
- Downsampling
- Multi-tenancy
- Scalability and cluster version
- Alerting
- Security
- Tuning
- Monitoring
- Troubleshooting
- Data migration
- Backfilling
- Data updates
- Replication
- Backups
- Profiling
- Integrations
- Third-party contributions
- Contacts
- Community and contributions
- Reporting bugs
- Victoria Metrics Logo
How to start VictoriaMetrics
Start VictoriaMetrics executable or docker image with the desired command-line flags.
The following command-line flags are used the most:
-storageDataPath- path to data directory. VictoriaMetrics stores all the data in this directory. Default path isvictoria-metrics-datain the current working directory.-retentionPeriod- retention for stored data. Older data is automatically deleted. Default retention is 1 month. See these docs for more details.
Other flags have good enough default values, so set them only if you really need this. Pass -help to see all the available flags with description and default values.
See how to ingest data to VictoriaMetrics, how to query VictoriaMetrics and how to handle alerts. VictoriaMetrics accepts Prometheus querying API requests on port 8428 by default.
It is recommended setting up monitoring for VictoriaMetrics.
Environment variables
Each flag value can be set via environment variables according to these rules:
- The
-envflag.enableflag must be set - Each
.char in flag name must be substituted by_(for example-insert.maxQueueDuration <duration>will translate toinsert_maxQueueDuration=<duration>) - For repeating flags an alternative syntax can be used by joining the different values into one using
,char as separator (for example-storageNode <nodeA> -storageNode <nodeB>will translate tostorageNode=<nodeA>,<nodeB>) - It is possible setting prefix for environment vars with
-envflag.prefix. For instance, if-envflag.prefix=VM_, then env vars must be prepended withVM_
Configuration with snap package
Command-line flags can be changed with following command:
echo 'FLAGS="-selfScrapeInterval=10s -search.logSlowQueryDuration=20s"' > $SNAP_DATA/var/snap/victoriametrics/current/extra_flags
snap restart victoriametrics
Or add needed command-line flags to the file $SNAP_DATA/var/snap/victoriametrics/current/extra_flags.
Note you cannot change value for -storageDataPath flag, for safety snap package has limited access to host system.
Changing scrape configuration is possible with text editor: text vi $SNAP_DATA/var/snap/victoriametrics/current/etc/victoriametrics-scrape-config.yaml After changes was made, trigger config re-read with command curl 127.0.0.1:8248/-/reload.
Prometheus setup
Prometheus must be configured with remote_write in order to send data to VictoriaMetrics. Add the following lines to Prometheus config file (it is usually located at /etc/prometheus/prometheus.yml):
remote_write:
  - url: http://<victoriametrics-addr>:8428/api/v1/write
Substitute <victoriametrics-addr> with hostname or IP address of VictoriaMetrics. Then apply new config via the following command:
kill -HUP `pidof prometheus`
Prometheus writes incoming data to local storage and replicates it to remote storage in parallel. This means that data remains available in local storage for --storage.tsdb.retention.time duration even if remote storage is unavailable.
If you plan to send data to VictoriaMetrics from multiple Prometheus instances, then add the following lines into global section of Prometheus config:
global:
  external_labels:
    datacenter: dc-123
This instructs Prometheus to add datacenter=dc-123 label to each time series sent to remote storage. The label name can be arbitrary - datacenter is just an example. The label value must be unique across Prometheus instances, so those time series may be filtered and grouped by this label.
For highly loaded Prometheus instances (400k+ samples per second) the following tuning may be applied:
remote_write:
  - url: http://<victoriametrics-addr>:8428/api/v1/write
    queue_config:
      max_samples_per_send: 10000
      capacity: 20000
      max_shards: 30
Using remote write increases memory usage for Prometheus up to ~25% and depends on the shape of data. If you are experiencing issues with too high memory consumption try to lower max_samples_per_send and capacity params (keep in mind that these two params are tightly connected). Read more about tuning remote write for Prometheus here.
It is recommended upgrading Prometheus to v2.12.0 or newer, since previous versions may have issues with remote_write.
Take a look also at vmagent and vmalert, which can be used as faster and less resource-hungry alternative to Prometheus.
Grafana setup
Create Prometheus datasource in Grafana with the following url:
http://<victoriametrics-addr>:8428
Substitute <victoriametrics-addr> with the hostname or IP address of VictoriaMetrics.
Then build graphs with the created datasource using PromQL or MetricsQL. VictoriaMetrics supports Prometheus querying API, which is used by Grafana.
How to upgrade VictoriaMetrics
It is safe upgrading VictoriaMetrics to new versions unless release notes say otherwise. It is safe skipping multiple versions during the upgrade unless release notes say otherwise. It is recommended performing regular upgrades to the latest version, since it may contain important bug fixes, performance optimizations or new features.
It is also safe downgrading to the previous version unless release notes say otherwise.
The following steps must be performed during the upgrade / downgrade:
- Send
SIGINTsignal to VictoriaMetrics process in order to gracefully stop it. - Wait until the process stops. This can take a few seconds.
- Start the upgraded VictoriaMetrics.
Prometheus doesn't drop data during VictoriaMetrics restart. See this article for details.
How to apply new config to VictoriaMetrics
VictoriaMetrics is configured via command-line flags, so it must be restarted when new command-line flags should be applied:
- Send
SIGINTsignal to VictoriaMetrics process in order to gracefully stop it. - Wait until the process stops. This can take a few seconds.
- Start VictoriaMetrics with the new command-line flags.
Prometheus doesn't drop data during VictoriaMetrics restart. See this article for details.
How to scrape Prometheus exporters such as node-exporter
VictoriaMetrics can be used as drop-in replacement for Prometheus for scraping targets configured in prometheus.yml config file according to the specification. Just set -promscrape.config command-line flag to the path to prometheus.yml config - and VictoriaMetrics should start scraping the configured targets. Currently the following scrape_config types are supported:
- static_config
- file_sd_config
- kubernetes_sd_config
- ec2_sd_config
- gce_sd_config
- consul_sd_config
- dns_sd_config
- openstack_sd_config
- dockerswarm_sd_config
- eureka_sd_config
Other *_sd_config types will be supported in the future.
The file pointed by -promscrape.config may contain %{ENV_VAR} placeholders, which are substituted by the corresponding ENV_VAR environment variable values.
VictoriaMetrics also supports importing data in Prometheus exposition format.
See also vmagent, which can be used as drop-in replacement for Prometheus.
How to send data from InfluxDB-compatible agents such as Telegraf
Use http://<victoriametric-addr>:8428 url instead of InfluxDB url in agents' configs. For instance, put the following lines into Telegraf config, so it sends data to VictoriaMetrics instead of InfluxDB:
[[outputs.influxdb]]
  urls = ["http://<victoriametrics-addr>:8428"]
Another option is to enable TCP and UDP receiver for Influx line protocol via -influxListenAddr command-line flag and stream plain Influx line protocol data to the configured TCP and/or UDP addresses.
VictoriaMetrics maps Influx data using the following rules:
dbquery arg is mapped intodblabel value unlessdbtag exists in the Influx line.- Field names are mapped to time series names prefixed with
{measurement}{separator}value, where{separator}equals to_by default. It can be changed with-influxMeasurementFieldSeparatorcommand-line flag. See also-influxSkipSingleFieldcommand-line flag. If{measurement}is empty or-influxSkipMeasurementcommand-line flag is set, then time series names correspond to field names. - Field values are mapped to time series values.
- Tags are mapped to Prometheus labels as-is.
For example, the following Influx line:
foo,tag1=value1,tag2=value2 field1=12,field2=40
is converted into the following Prometheus data points:
foo_field1{tag1="value1", tag2="value2"} 12
foo_field2{tag1="value1", tag2="value2"} 40
Example for writing data with Influx line protocol to local VictoriaMetrics using curl:
curl -d 'measurement,tag1=value1,tag2=value2 field1=123,field2=1.23' -X POST 'http://localhost:8428/write'
An arbitrary number of lines delimited by '\n' (aka newline char) can be sent in a single request. After that the data may be read via /api/v1/export endpoint:
curl -G 'http://localhost:8428/api/v1/export' -d 'match={__name__=~"measurement_.*"}'
The /api/v1/export endpoint should return the following response:
{"metric":{"__name__":"measurement_field1","tag1":"value1","tag2":"value2"},"values":[123],"timestamps":[1560272508147]}
{"metric":{"__name__":"measurement_field2","tag1":"value1","tag2":"value2"},"values":[1.23],"timestamps":[1560272508147]}
Note that Influx line protocol expects timestamps in nanoseconds by default, while VictoriaMetrics stores them with milliseconds precision.
Extra labels may be added to all the written time series by passing extra_label=name=value query args. For example, /write?extra_label=foo=bar would add {foo="bar"} label to all the ingested metrics.
How to send data from Graphite-compatible agents such as StatsD
Enable Graphite receiver in VictoriaMetrics by setting -graphiteListenAddr command line flag. For instance, the following command will enable Graphite receiver in VictoriaMetrics on TCP and UDP port 2003:
/path/to/victoria-metrics-prod -graphiteListenAddr=:2003
Use the configured address in Graphite-compatible agents. For instance, set graphiteHost to the VictoriaMetrics host in StatsD configs.
Example for writing data with Graphite plaintext protocol to local VictoriaMetrics using nc:
echo "foo.bar.baz;tag1=value1;tag2=value2 123 `date +%s`" | nc -N localhost 2003
VictoriaMetrics sets the current time if the timestamp is omitted. An arbitrary number of lines delimited by \n (aka newline char) can be sent in one go. After that the data may be read via /api/v1/export endpoint:
curl -G 'http://localhost:8428/api/v1/export' -d 'match=foo.bar.baz'
The /api/v1/export endpoint should return the following response:
{"metric":{"__name__":"foo.bar.baz","tag1":"value1","tag2":"value2"},"values":[123],"timestamps":[1560277406000]}
Querying Graphite data
Data sent to VictoriaMetrics via Graphite plaintext protocol may be read via the following APIs:
- Graphite API
- Prometheus querying API. Graphite metric names may special chars such as
-, which may clash with MetricsQL operations. Such metrics can be queries via{__name__="foo-bar.baz"}. VictoriaMetrics supports__graphite__pseudo-label for selecting time series with Graphite-compatible filters in MetricsQL. For example,{__graphite__="foo.*.bar"}is equivalent to{__name__=~"foo[.][^.]*[.]bar"}, but it works faster and it is easier to use when migrating from Graphite to VictoriaMetrics. - go-graphite/carbonapi
How to send data from OpenTSDB-compatible agents
VictoriaMetrics supports telnet put protocol and HTTP /api/put requests for ingesting OpenTSDB data. The same protocol is used for ingesting data in KairosDB.
Sending data via telnet put protocol
Enable OpenTSDB receiver in VictoriaMetrics by setting -opentsdbListenAddr command line flag. For instance, the following command enables OpenTSDB receiver in VictoriaMetrics on TCP and UDP port 4242:
/path/to/victoria-metrics-prod -opentsdbListenAddr=:4242
Send data to the given address from OpenTSDB-compatible agents.
Example for writing data with OpenTSDB protocol to local VictoriaMetrics using nc:
echo "put foo.bar.baz `date +%s` 123 tag1=value1 tag2=value2" | nc -N localhost 4242
An arbitrary number of lines delimited by \n (aka newline char) can be sent in one go. After that the data may be read via /api/v1/export endpoint:
curl -G 'http://localhost:8428/api/v1/export' -d 'match=foo.bar.baz'
The /api/v1/export endpoint should return the following response:
{"metric":{"__name__":"foo.bar.baz","tag1":"value1","tag2":"value2"},"values":[123],"timestamps":[1560277292000]}
Sending OpenTSDB data via HTTP /api/put requests
Enable HTTP server for OpenTSDB /api/put requests by setting -opentsdbHTTPListenAddr command line flag. For instance, the following command enables OpenTSDB HTTP server on port 4242:
/path/to/victoria-metrics-prod -opentsdbHTTPListenAddr=:4242
Send data to the given address from OpenTSDB-compatible agents.
Example for writing a single data point:
curl -H 'Content-Type: application/json' -d '{"metric":"x.y.z","value":45.34,"tags":{"t1":"v1","t2":"v2"}}' http://localhost:4242/api/put
Example for writing multiple data points in a single request:
curl -H 'Content-Type: application/json' -d '[{"metric":"foo","value":45.34},{"metric":"bar","value":43}]' http://localhost:4242/api/put
After that the data may be read via /api/v1/export endpoint:
curl -G 'http://localhost:8428/api/v1/export' -d 'match[]=x.y.z' -d 'match[]=foo' -d 'match[]=bar'
The /api/v1/export endpoint should return the following response:
{"metric":{"__name__":"foo"},"values":[45.34],"timestamps":[1566464846000]}
{"metric":{"__name__":"bar"},"values":[43],"timestamps":[1566464846000]}
{"metric":{"__name__":"x.y.z","t1":"v1","t2":"v2"},"values":[45.34],"timestamps":[1566464763000]}
Extra labels may be added to all the imported time series by passing extra_label=name=value query args. For example, /api/put?extra_label=foo=bar would add {foo="bar"} label to all the ingested metrics.
Prometheus querying API usage
VictoriaMetrics supports the following handlers from Prometheus querying API:
- /api/v1/query
- /api/v1/query_range
- /api/v1/series
- /api/v1/labels
- /api/v1/label/.../values
- /api/v1/status/tsdb. VictoriaMetrics accepts optional
topN=Nanddate=YYYY-MM-DDquery args for this handler, whereNis the number of top entries to return in the response andYYYY-MM-DDis the date for collecting the stats. By default top 10 entries are returned and the stats is collected for the current day. - /api/v1/targets - see these docs for more details.
These handlers can be queried from Prometheus-compatible clients such as Grafana or curl.
Prometheus querying API enhancements
VictoriaMetrics accepts optional extra_label=<label_name>=<label_value> query arg, which can be used for enforcing additional label filters for queries. For example, /api/v1/query_range?extra_label=user_id=123&query=<query> would automatically add {user_id="123"} label filter to the given <query>. This functionality can be used for limiting the scope of time series visible to the given tenant. It is expected that the extra_label query arg is automatically set by auth proxy sitting in front of VictoriaMetrics. Contact us if you need assistance with such a proxy.
VictoriaMetrics accepts relative times in time, start and end query args additionally to unix timestamps and RFC3339. For example, the following query would return data for the last 30 minutes: /api/v1/query_range?start=-30m&query=....
By default, VictoriaMetrics returns time series for the last 5 minutes from /api/v1/series, while the Prometheus API defaults to all time. Use start and end to select a different time range.
VictoriaMetrics accepts additional args for /api/v1/labels and /api/v1/label/.../values handlers. See this feature request for details:
- Any number time series selectors via
match[]query arg. - Optional
startandendquery args for limiting the time range for the selected labels or label values.
Additionally VictoriaMetrics provides the following handlers:
-
/api/v1/series/count- returns the total number of time series in the database. Some notes:- the handler scans all the inverted index, so it can be slow if the database contains tens of millions of time series;
- the handler may count deleted time series additionally to normal time series due to internal implementation restrictions;
-
/api/v1/labels/count- returns a list oflabel: values_countentries. It can be used for determining labels with the maximum number of values. -
/api/v1/status/active_queries- returns a list of currently running queries. -
/api/v1/status/top_queries- returns the following query lists:- the most frequently executed queries -
topByCount - queries with the biggest average execution duration -
topByAvgDuration - queries that took the most time for execution -
topBySumDuration
The number of returned queries can be limited via
topNquery arg. Old queries can be filtered out withmaxLifetimequery arg. For example, request to/api/v1/status/top_queries?topN=5&maxLifetime=30swould return up to 5 queries per list, which were executed during the last 30 seconds. VictoriaMetrics tracks the last-search.queryStats.lastQueriesCountqueries with durations at least-search.queryStats.minQueryDuration. - the most frequently executed queries -
Graphite API usage
VictoriaMetrics supports the following Graphite APIs, which are needed for Graphite datasource in Grafana:
- Render API - see these docs.
- Metrics API - see these docs.
- Tags API - see these docs.
VictoriaMetrics supports __graphite__ pseudo-label for filtering time series with Graphite-compatible filters in MetricsQL. For example, {__graphite__="foo.*.bar"} is equivalent to {__name__=~"foo[.][^.]*[.]bar"}, but it works faster and it is easier to use when migrating from Graphite to VictoriaMetrics.
Graphite Render API usage
VictoriaMetrics Enterprise supports Graphite Render API subset, which is needed for Graphite datasource in Grafana.
Graphite Metrics API usage
VictoriaMetrics supports the following handlers from Graphite Metrics API:
VictoriaMetrics accepts the following additional query args at /metrics/find and /metrics/expand:
label- for selecting arbitrary label values. By defaultlabel=__name__, i.e. metric names are selected.delimiter- for using different delimiters in metric name hierachy. For example,/metrics/find?delimiter=_&query=node_*would return all the metric name prefixes that start withnode_. By defaultdelimiter=..
Graphite Tags API usage
VictoriaMetrics supports the following handlers from Graphite Tags API:
- /tags/tagSeries
- /tags/tagMultiSeries
- /tags
- /tags/{tag_name}
- /tags/findSeries
- /tags/autoComplete/tags
- /tags/autoComplete/values
- /tags/delSeries
How to build from sources
We recommend using either binary releases or docker images instead of building VictoriaMetrics from sources. Building from sources is reasonable when developing additional features specific to your needs or when testing bugfixes.
Development build
- Install Go. The minimum supported version is Go 1.13.
- Run
make victoria-metricsfrom the root folder of the repository. It buildsvictoria-metricsbinary and puts it into thebinfolder.
Production build
- Install docker.
- Run
make victoria-metrics-prodfrom the root folder of the repository. It buildsvictoria-metrics-prodbinary and puts it into thebinfolder.
ARM build
ARM build may run on Raspberry Pi or on energy-efficient ARM servers.
Development ARM build
- Install Go. The minimum supported version is Go 1.13.
- Run
make victoria-metrics-armormake victoria-metrics-arm64from the root folder of the repository. It buildsvictoria-metrics-armorvictoria-metrics-arm64binary respectively and puts it into thebinfolder.
Production ARM build
- Install docker.
- Run
make victoria-metrics-arm-prodormake victoria-metrics-arm64-prodfrom the root folder of the repository. It buildsvictoria-metrics-arm-prodorvictoria-metrics-arm64-prodbinary respectively and puts it into thebinfolder.
Pure Go build (CGO_ENABLED=0)
Pure Go mode builds only Go code without cgo dependencies. This is an experimental mode, which may result in a lower compression ratio and slower decompression performance. Use it with caution!
- Install Go. The minimum supported version is Go 1.13.
- Run
make victoria-metrics-purefrom the root folder of the repository. It buildsvictoria-metrics-purebinary and puts it into thebinfolder.
Building docker images
Run make package-victoria-metrics. It builds victoriametrics/victoria-metrics:<PKG_TAG> docker image locally. <PKG_TAG> is auto-generated image tag, which depends on source code in the repository. The <PKG_TAG> may be manually set via PKG_TAG=foobar make package-victoria-metrics.
The base docker image is alpine but it is possible to use any other base image by setting it via <ROOT_IMAGE> environment variable. For example, the following command builds the image on top of scratch image:
ROOT_IMAGE=scratch make package-victoria-metrics
Start with docker-compose
Docker-compose helps to spin up VictoriaMetrics, vmagent and Grafana with one command. More details may be found here.
Setting up service
Read these instructions on how to set up VictoriaMetrics as a service in your OS. There is also snap package for Ubuntu.
How to work with snapshots
VictoriaMetrics can create instant snapshots for all the data stored under -storageDataPath directory. Navigate to http://<victoriametrics-addr>:8428/snapshot/create in order to create an instant snapshot. The page will return the following JSON response:
{"status":"ok","snapshot":"<snapshot-name>"}
Snapshots are created under <-storageDataPath>/snapshots directory, where <-storageDataPath> is the command-line flag value. Snapshots can be archived to backup storage at any time with vmbackup.
The http://<victoriametrics-addr>:8428/snapshot/list page contains the list of available snapshots.
Navigate to http://<victoriametrics-addr>:8428/snapshot/delete?snapshot=<snapshot-name> in order to delete <snapshot-name> snapshot.
Navigate to http://<victoriametrics-addr>:8428/snapshot/delete_all in order to delete all the snapshots.
Steps for restoring from a snapshot:
- Stop VictoriaMetrics with
kill -INT. - Restore snapshot contents from backup with vmrestore to the directory pointed by
-storageDataPath. - Start VictoriaMetrics.
How to delete time series
Send a request to http://<victoriametrics-addr>:8428/api/v1/admin/tsdb/delete_series?match[]=<timeseries_selector_for_delete>, where <timeseries_selector_for_delete> may contain any time series selector for metrics to delete. After that all the time series matching the given selector are deleted. Storage space for the deleted time series isn't freed instantly - it is freed during subsequent background merges of data files. Note that background merges may never occur for data from previous months, so storage space won't be freed for historical data. In this case forced merge may help freeing up storage space.
It is recommended verifying which metrics will be deleted with the call to http://<victoria-metrics-addr>:8428/api/v1/series?match[]=<timeseries_selector_for_delete> before actually deleting the metrics. By default this query will only scan active series in the past 5 minutes, so you may need to adjust start and end to a suitable range to achieve match hits.
The /api/v1/admin/tsdb/delete_series handler may be protected with authKey if -deleteAuthKey command-line flag is set.
The delete API is intended mainly for the following cases:
- One-off deleting of accidentally written invalid (or undesired) time series.
- One-off deleting of user data due to GDPR.
It isn't recommended using delete API for the following cases, since it brings non-zero overhead:
- Regular cleanups for unneeded data. Just prevent writing unneeded data into VictoriaMetrics. This can be done with relabeling. See this article for details.
- Reducing disk space usage by deleting unneeded time series. This doesn't work as expected, since the deleted time series occupy disk space until the next merge operation, which can never occur when deleting too old data. Forced merge may be used for freeing up disk space occupied by old data.
It is better using -retentionPeriod command-line flag for efficient pruning of old data.
Forced merge
VictoriaMetrics performs data compactions in background in order to keep good performance characteristics when accepting new data. These compactions (merges) are performed independently on per-month partitions. This means that compactions are stopped for per-month partitions if no new data is ingested into these partitions. Sometimes it is necessary to trigger compactions for old partitions. For instance, in order to free up disk space occupied by deleted time series. In this case forced compaction may be initiated on the specified per-month partition by sending request to /internal/force_merge?partition_prefix=YYYY_MM, where YYYY_MM is per-month partition name. For example, http://victoriametrics:8428/internal/force_merge?partition_prefix=2020_08 would initiate forced merge for August 2020 partition. The call to /internal/force_merge returns immediately, while the corresponding forced merge continues running in background.
Forced merges may require additional CPU, disk IO and storage space resources. It is unnecessary to run forced merge under normal conditions, since VictoriaMetrics automatically performs optimal merges in background when new data is ingested into it.
How to export time series
VictoriaMetrics provides the following handlers for exporting data:
/api/v1/export/nativefor exporting data in native binary format. This is the most efficient format for data export. See these docs for details./api/v1/exportfor exporing data in JSON line format. See these docs for details./api/v1/export/csvfor exporting data in CSV. See these docs for details.
How to export data in native format
Send a request to http://<victoriametrics-addr>:8428/api/v1/export/native?match[]=<timeseries_selector_for_export>, where <timeseries_selector_for_export> may contain any time series selector for metrics to export. Use {__name__=~".*"} selector for fetching all the time series.
On large databases you may experience problems with limit on unique timeseries (default value is 300000). In this case you need to adjust -search.maxUniqueTimeseries parameter:
# count unique timeseries in database
wget -O- -q 'http://your_victoriametrics_instance:8428/api/v1/series/count' | jq '.data[0]'

# relaunch victoriametrics with search.maxUniqueTimeseries more than value from previous command
Optional start and end args may be added to the request in order to limit the time frame for the exported data. These args may contain either unix timestamp in seconds or RFC3339 values.
The exported data can be imported to VictoriaMetrics via /api/v1/import/native.
How to export data in JSON line format
Send a request to http://<victoriametrics-addr>:8428/api/v1/export?match[]=<timeseries_selector_for_export>, where <timeseries_selector_for_export> may contain any time series selector for metrics to export. Use {__name__!=""} selector for fetching all the time series. The response would contain all the data for the selected time series in JSON streaming format. Each JSON line contains samples for a single time series. An example output:
{"metric":{"__name__":"up","job":"node_exporter","instance":"localhost:9100"},"values":[0,0,0],"timestamps":[1549891472010,1549891487724,1549891503438]}
{"metric":{"__name__":"up","job":"prometheus","instance":"localhost:9090"},"values":[1,1,1],"timestamps":[1549891461511,1549891476511,1549891491511]}
Optional start and end args may be added to the request in order to limit the time frame for the exported data. These args may contain either unix timestamp in seconds or RFC3339 values.
Optional max_rows_per_line arg may be added to the request for limiting the maximum number of rows exported per each JSON line. Optional reduce_mem_usage=1 arg may be added to the request for reducing memory usage when exporting big number of time series. In this case the output may contain multiple lines with distinct samples for the same time series.
Pass Accept-Encoding: gzip HTTP header in the request to /api/v1/export in order to reduce network bandwidth during exporing big amounts of time series data. This enables gzip compression for the exported data. Example for exporting gzipped data:
curl -H 'Accept-Encoding: gzip' http://localhost:8428/api/v1/export -d 'match[]={__name__!=""}' > data.jsonl.gz
The maximum duration for each request to /api/v1/export is limited by -search.maxExportDuration command-line flag.
Exported data can be imported via POST'ing it to /api/v1/import.
How to export CSV data
Send a request to http://<victoriametrics-addr>:8428/api/v1/export/csv?format=<format>&match=<timeseries_selector_for_export>, where:
-
<format>must contain comma-delimited label names for the exported CSV. The following special label names are supported:__name__- metric name__value__- sample value__timestamp__:<ts_format>- sample timestamp.<ts_format>can have the following values:unix_s- unix secondsunix_ms- unix millisecondsunix_ns- unix nanosecondsrfc3339- RFC3339 timecustom:<layout>- custom layout for time that is supported by time.Format function from Go.
-
<timeseries_selector_for_export>may contain any time series selector for metrics to export.
Optional start and end args may be added to the request in order to limit the time frame for the exported data. These args may contain either unix timestamp in seconds or RFC3339 values.
The exported CSV data can be imported to VictoriaMetrics via /api/v1/import/csv.
How to import time series data
Time series data can be imported via any supported ingestion protocol:
- Prometheus remote_write API. See these docs for details.
- Influx line protocol. See these docs for details.
- Graphite plaintext protocol. See these docs for details.
- OpenTSDB telnet put protocol. See these docs for details.
- OpenTSDB http
/api/putprotocol. See these docs for details. /api/v1/importfor importing data obtained from /api/v1/export. See these docs for details./api/v1/import/nativefor importing data obtained from /api/v1/export/native. See these docs for details./api/v1/import/csvfor importing arbitrary CSV data. See these docs for details./api/v1/import/prometheusfor importing data in Prometheus exposition format. See these docs for details.
How to import data in native format
The specification of VictoriaMetrics' native format may yet change and is not formally documented yet. So currently we do not recommend that external clients attempt to pack their own metrics in native format file.
If you have a native format file obtained via /api/v1/export/native however this is the most efficient protocol for importing data in.
# Export the data from <source-victoriametrics>:
curl http://source-victoriametrics:8428/api/v1/export/native -d 'match={__name__!=""}' > exported_data.bin

# Import the data to <destination-victoriametrics>:
curl -X POST http://destination-victoriametrics:8428/api/v1/import/native -T exported_data.bin
Pass Content-Encoding: gzip HTTP request header to /api/v1/import/native for importing gzipped data:
# Export gzipped data from <source-victoriametrics>:
curl -H 'Accept-Encoding: gzip' http://source-victoriametrics:8428/api/v1/export/native -d 'match={__name__!=""}' > exported_data.bin.gz

# Import gzipped data to <destination-victoriametrics>:
curl -X POST -H 'Content-Encoding: gzip' http://destination-victoriametrics:8428/api/v1/import/native -T exported_data.bin.gz
Extra labels may be added to all the imported time series by passing extra_label=name=value query args. For example, /api/v1/import/native?extra_label=foo=bar would add "foo":"bar" label to all the imported time series.
Note that it could be required to flush response cache after importing historical data. See these docs for detail.
How to import data in JSON line format
Example for importing data obtained via /api/v1/export:
# Export the data from <source-victoriametrics>:
curl http://source-victoriametrics:8428/api/v1/export -d 'match={__name__!=""}' > exported_data.jsonl

# Import the data to <destination-victoriametrics>:
curl -X POST http://destination-victoriametrics:8428/api/v1/import -T exported_data.jsonl
Pass Content-Encoding: gzip HTTP request header to /api/v1/import for importing gzipped data:
# Export gzipped data from <source-victoriametrics>:
curl -H 'Accept-Encoding: gzip' http://source-victoriametrics:8428/api/v1/export -d 'match={__name__!=""}' > exported_data.jsonl.gz

# Import gzipped data to <destination-victoriametrics>:
curl -X POST -H 'Content-Encoding: gzip' http://destination-victoriametrics:8428/api/v1/import -T exported_data.jsonl.gz
Extra labels may be added to all the imported time series by passing extra_label=name=value query args. For example, /api/v1/import?extra_label=foo=bar would add "foo":"bar" label to all the imported time series.
Note that it could be required to flush response cache after importing historical data. See these docs for detail.
How to import CSV data
Arbitrary CSV data can be imported via /api/v1/import/csv. The CSV data is imported according to the provided format query arg. The format query arg must contain comma-separated list of parsing rules for CSV fields. Each rule consists of three parts delimited by a colon:
<column_pos>:<type>:<context>
<column_pos>is the position of the CSV column (field). Column numbering starts from 1. The order of parsing rules may be arbitrary.<type>describes the column type. Supported types are:metric- the corresponding CSV column at<column_pos>contains metric value, which must be integer or floating-point number. The metric name is read from the<context>. CSV line must have at least a single metric field. Multiple metric fields per CSV line is OK.label- the corresponding CSV column at<column_pos>contains label value. The label name is read from the<context>. CSV line may have arbitrary number of label fields. All these labels are attached to all the configured metrics.time- the corresponding CSV column at<column_pos>contains metric time. CSV line may contain either one or zero columns with time. If CSV line has no time, then the current time is used. The time is applied to all the configured metrics. The format of the time is configured via<context>. Supported time formats are:unix_s- unix timestamp in seconds.unix_ms- unix timestamp in milliseconds.unix_ns- unix timestamp in nanoseconds. Note that VictoriaMetrics rounds the timestamp to milliseconds.rfc3339- timestamp in RFC3339 format, i.e.2006-01-02T15:04:05Z.custom:<layout>- custom layout for the timestamp. The<layout>may contain arbitrary time layout according to time.Parse rules in Go.
Each request to /api/v1/import/csv may contain arbitrary number of CSV lines.
Example for importing CSV data via /api/v1/import/csv:
curl -d "GOOG,1.23,4.56,NYSE" 'http://localhost:8428/api/v1/import/csv?format=2:metric:ask,3:metric:bid,1:label:ticker,4:label:market'
curl -d "MSFT,3.21,1.67,NASDAQ" 'http://localhost:8428/api/v1/import/csv?format=2:metric:ask,3:metric:bid,1:label:ticker,4:label:market'
After that the data may be read via /api/v1/export endpoint:
curl -G 'http://localhost:8428/api/v1/export' -d 'match[]={ticker!=""}'
The following response should be returned:
{"metric":{"__name__":"bid","market":"NASDAQ","ticker":"MSFT"},"values":[1.67],"timestamps":[1583865146520]}
{"metric":{"__name__":"bid","market":"NYSE","ticker":"GOOG"},"values":[4.56],"timestamps":[1583865146495]}
{"metric":{"__name__":"ask","market":"NASDAQ","ticker":"MSFT"},"values":[3.21],"timestamps":[1583865146520]}
{"metric":{"__name__":"ask","market":"NYSE","ticker":"GOOG"},"values":[1.23],"timestamps":[1583865146495]}
Extra labels may be added to all the imported lines by passing extra_label=name=value query args. For example, /api/v1/import/csv?extra_label=foo=bar would add "foo":"bar" label to all the imported lines.
Note that it could be required to flush response cache after importing historical data. See these docs for detail.
How to import data in Prometheus exposition format
VictoriaMetrics accepts data in Prometheus exposition format via /api/v1/import/prometheus path. For example, the following line imports a single line in Prometheus exposition format into VictoriaMetrics:
curl -d 'foo{bar="baz"} 123' -X POST 'http://localhost:8428/api/v1/import/prometheus'
The following command may be used for verifying the imported data:
curl -G 'http://localhost:8428/api/v1/export' -d 'match={__name__=~"foo"}'
It should return something like the following:
{"metric":{"__name__":"foo","bar":"baz"},"values":[123],"timestamps":[1594370496905]}
Extra labels may be added to all the imported metrics by passing extra_label=name=value query args. For example, /api/v1/import/prometheus?extra_label=foo=bar would add {foo="bar"} label to all the imported metrics.
If timestamp is missing in <metric> <value> <timestamp> Prometheus exposition format line, then the current timestamp is used during data ingestion. It can be overriden by passing unix timestamp in milliseconds via timestamp query arg. For example, /api/v1/import/prometheus?timestamp=1594370496905.
VictoriaMetrics accepts arbitrary number of lines in a single request to /api/v1/import/prometheus, i.e. it supports data streaming.
Note that it could be required to flush response cache after importing historical data. See these docs for detail.
VictoriaMetrics also may scrape Prometheus targets - see these docs.
Relabeling
VictoriaMetrics supports Prometheus-compatible relabeling for all the ingested metrics if -relabelConfig command-line flag points to a file containing a list of relabel_config entries. See this article with relabeling tips and tricks.
Example contents for -relabelConfig file:
# Add {cluster="dev"} label.
- target_label: cluster
  replacement: dev

# Drop the metric (or scrape target) with `{__meta_kubernetes_pod_container_init="true"}` label.
- action: drop
  source_labels: [__meta_kubernetes_pod_container_init]
  regex: true
VictoriaMetrics provides the following extra actions for relabeling rules:
replace_all: replaces all the occurences ofregexin the values ofsource_labelswith thereplacementand stores the result in thetarget_label.labelmap_all: replaces all the occurences ofregexin all the label names with thereplacement.keep_if_equal: keeps the entry if all label values fromsource_labelsare equal.drop_if_equal: drops the entry if all the label values fromsource_labelsare equal.
See also relabeling in vmagent.
Federation
VictoriaMetrics exports Prometheus-compatible federation data at http://<victoriametrics-addr>:8428/federate?match[]=<timeseries_selector_for_federation>.
Optional start and end args may be added to the request in order to scrape the last point for each selected time series on the [start ... end] interval. start and end may contain either unix timestamp in seconds or RFC3339 values. By default, the last point on the interval [now - max_lookback ... now] is scraped for each time series. The default value for max_lookback is 5m (5 minutes), but it can be overridden. For instance, /federate?match[]=up&max_lookback=1h would return last points on the [now - 1h ... now] interval. This may be useful for time series federation with scrape intervals exceeding 5m.
Capacity planning
A rough estimation of the required resources for ingestion path:
-
RAM size: less than 1KB per active time series. So, ~1GB of RAM is required for 1M active time series. Time series is considered active if new data points have been added to it recently or if it has been recently queried. The number of active time series may be obtained from
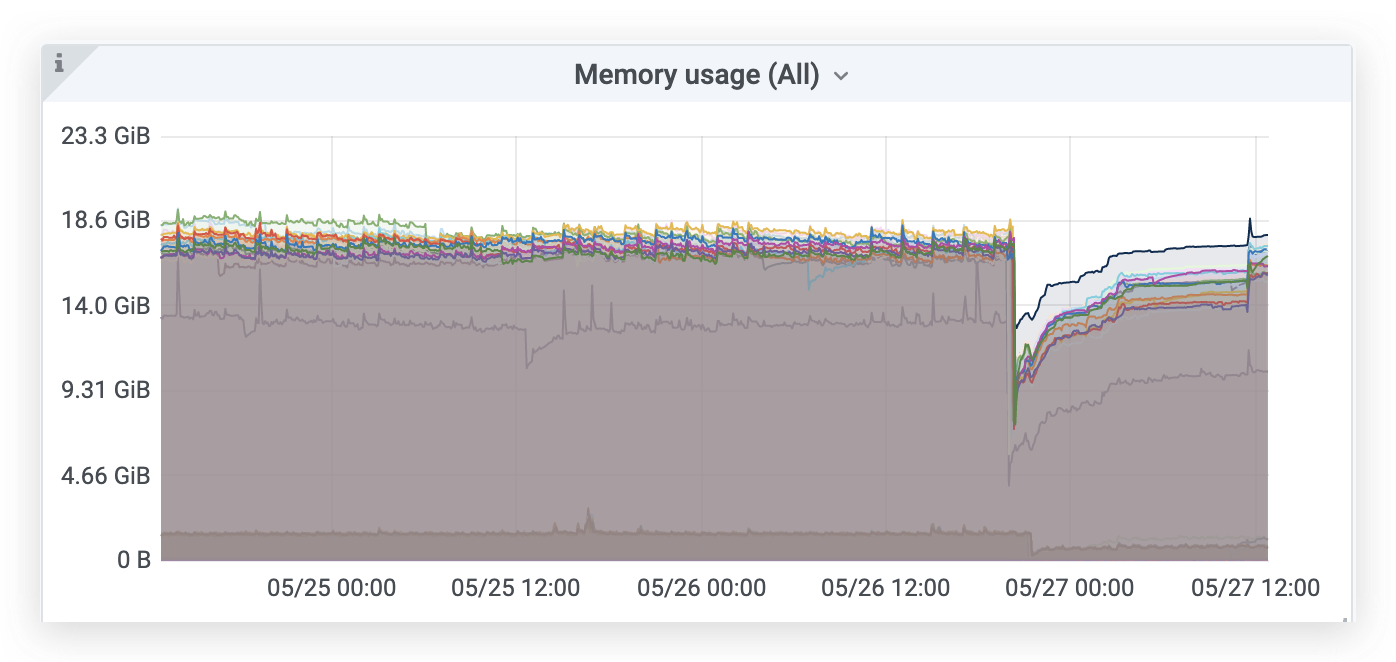
vm_cache_entries{type="storage/hour_metric_ids"}metric exported on the/metricspage. VictoriaMetrics stores various caches in RAM. Memory size for these caches may be limited with-memory.allowedPercentor-memory.allowedBytesflags. -
CPU cores: a CPU core per 300K inserted data points per second. So, ~4 CPU cores are required for processing the insert stream of 1M data points per second. The ingestion rate may be lower for high cardinality data or for time series with high number of labels. See this article for details. If you see lower numbers per CPU core, then it is likely active time series info doesn't fit caches, so you need more RAM for lowering CPU usage.
-
Storage space: less than a byte per data point on average. So, ~260GB is required for storing a month-long insert stream of 100K data points per second. The actual storage size heavily depends on data randomness (entropy). Higher randomness means higher storage size requirements. Read this article for details.
-
Network usage: outbound traffic is negligible. Ingress traffic is ~100 bytes per ingested data point via Prometheus remote_write API. The actual ingress bandwidth usage depends on the average number of labels per ingested metric and the average size of label values. The higher number of per-metric labels and longer label values mean the higher ingress bandwidth.
The required resources for query path:
-
RAM size: depends on the number of time series to scan in each query and the
stepargument passed to /api/v1/query_range. The higher number of scanned time series and lowerstepargument results in the higher RAM usage. -
CPU cores: a CPU core per 30 millions of scanned data points per second. This means that heavy queries that touch big number of time series (over 10K) and/or big number data points (over 100M) usually require more CPU resources than tiny queries that touch a few time series with small number of data points.
-
Network usage: depends on the frequency and the type of incoming requests. Typical Grafana dashboards usually require negligible network bandwidth.
High availability
- Install multiple VictoriaMetrics instances in distinct datacenters (availability zones).
- Pass addresses of these instances to vmagent via
-remoteWrite.urlcommand-line flag:
/path/to/vmagent -remoteWrite.url=http://<victoriametrics-addr-1>:8428/api/v1/write -remoteWrite.url=http://<victoriametrics-addr-2>:8428/api/v1/write
Alternatively these addresses may be passed to remote_write section in Prometheus config:
remote_write:
  - url: http://<victoriametrics-addr-1>:8428/api/v1/write
    queue_config:
      max_samples_per_send: 10000
  # ...
  - url: http://<victoriametrics-addr-N>:8428/api/v1/write
    queue_config:
      max_samples_per_send: 10000
- Apply the updated config:
kill -HUP `pidof prometheus`
It is recommended to use vmagent instead of Prometheus for highly loaded setups.
- Now Prometheus should write data into all the configured
remote_writeurls in parallel. - Set up Promxy in front of all the VictoriaMetrics replicas.
- Set up Prometheus datasource in Grafana that points to Promxy.
If you have Prometheus HA pairs with replicas r1 and r2 in each pair, then configure each r1 to write data to victoriametrics-addr-1, while each r2 should write data to victoriametrics-addr-2.
Another option is to write data simultaneously from Prometheus HA pair to a pair of VictoriaMetrics instances with the enabled de-duplication. See this section for details.
Deduplication
VictoriaMetrics de-duplicates data points if -dedup.minScrapeInterval command-line flag is set to positive duration. For example, -dedup.minScrapeInterval=60s would de-duplicate data points on the same time series if they fall within the same discrete 60s bucket. The earliest data point will be kept. In the case of equal timestamps, an arbitrary data point will be kept.
The recommended value for -dedup.minScrapeInterval must equal to scrape_interval config from Prometheus configs.
The de-duplication reduces disk space usage if multiple identically configured Prometheus instances in HA pair write data to the same VictoriaMetrics instance. Note that these Prometheus instances must have identical external_labels section in their configs, so they write data to the same time series.
Retention
Retention is configured with -retentionPeriod command-line flag. For instance, -retentionPeriod=3 means that the data will be stored for 3 months and then deleted. Data is split in per-month subdirectories inside <-storageDataPath>/data/small and <-storageDataPath>/data/big folders. Directories for months outside the configured retention are deleted on the first day of new month. In order to keep data according to -retentionPeriod max disk space usage is going to be -retentionPeriod + 1 month. For example if -retentionPeriod is set to 1, data for January is deleted on March 1st. It is safe to extend -retentionPeriod on existing data. If -retentionPeriod is set to lower value than before then data outside the configured period will be eventually deleted.
VictoriaMetrics supports retention smaller than 1 month. For example, -retentionPeriod=5d would set data retention for 5 days. Older data is eventually deleted during background merge.
Multiple retentions
Just start multiple VictoriaMetrics instances with distinct values for the following flags:
-retentionPeriod-storageDataPath, so the data for each retention period is saved in a separate directory-httpListenAddr, so clients may reach VictoriaMetrics instance with proper retention
Then set up vmauth in front of VictoriaMetrics instances, so it could route requests from particular user to VictoriaMetrics with the desired retention. The same scheme could be implemented for multiple tenants in VictoriaMetrics cluster.
Downsampling
There is no downsampling support at the moment, but:
- VictoriaMetrics is optimized for querying big amounts of raw data. See benchmark results for heavy queries in this article.
- VictoriaMetrics has good compression for on-disk data. See this article for details.
These properties reduce the need of downsampling. We plan to implement downsampling in the future. See this issue for details.
It is possible to (ab)use -dedup.minScrapeInterval for basic downsampling. For instance, if interval between the ingested data points is 15s, then -dedup.minScrapeInterval=5m will leave only a single data point out of 20 initial data points per each 5m interval.
Multi-tenancy
Single-node VictoriaMetrics doesn't support multi-tenancy. Use cluster version instead.
Scalability and cluster version
Though single-node VictoriaMetrics cannot scale to multiple nodes, it is optimized for resource usage - storage size / bandwidth / IOPS, RAM, CPU. This means that a single-node VictoriaMetrics may scale vertically and substitute a moderately sized cluster built with competing solutions such as Thanos, Uber M3, InfluxDB or TimescaleDB. See vertical scalability benchmarks.
So try single-node VictoriaMetrics at first and then switch to cluster version if you still need horizontally scalable long-term remote storage for really large Prometheus deployments. Contact us for paid support.
Alerting
It is recommended using vmalert for alerting.
Additionally, alerting can be set up with the following tools:
- With Prometheus - see the corresponding docs.
- With Promxy - see the corresponding docs.
- With Grafana - see the corresponding docs.
Security
Do not forget protecting sensitive endpoints in VictoriaMetrics when exposing it to untrusted networks such as the internet. Consider setting the following command-line flags:
-tls,-tlsCertFileand-tlsKeyFilefor switching from HTTP to HTTPS.-httpAuth.usernameand-httpAuth.passwordfor protecting all the HTTP endpoints with HTTP Basic Authentication.-deleteAuthKeyfor protecting/api/v1/admin/tsdb/delete_seriesendpoint. See how to delete time series.-snapshotAuthKeyfor protecting/snapshot*endpoints. See how to work with snapshots.-forceMergeAuthKeyfor protecting/internal/force_mergeendpoint. See force merge docs.-search.resetCacheAuthKeyfor protecting/internal/resetRollupResultCacheendpoint. See backfilling for more details.
Explicitly set internal network interface for TCP and UDP ports for data ingestion with Graphite and OpenTSDB formats. For example, substitute -graphiteListenAddr=:2003 with -graphiteListenAddr=<internal_iface_ip>:2003.
Prefer authorizing all the incoming requests from untrusted networks with vmauth or similar auth proxy.
Tuning
- There is no need for VictoriaMetrics tuning since it uses reasonable defaults for command-line flags, which are automatically adjusted for the available CPU and RAM resources.
- There is no need for Operating System tuning since VictoriaMetrics is optimized for default OS settings. The only option is increasing the limit on the number of open files in the OS, so Prometheus instances could establish more connections to VictoriaMetrics.
- The recommended filesystem is
ext4, the recommended persistent storage is persistent HDD-based disk on GCP, since it is protected from hardware failures via internal replication and it can be resized on the fly. If you plan to store more than 1TB of data onext4partition or plan extending it to more than 16TB, then the following options are recommended to pass tomkfs.ext4:
mkfs.ext4 ... -O 64bit,huge_file,extent -T huge
Monitoring
VictoriaMetrics exports internal metrics in Prometheus format at /metrics page. These metrics may be collected by vmagent or Prometheus by adding the corresponding scrape config to it. Alternatively they can be self-scraped by setting -selfScrapeInterval command-line flag to duration greater than 0. For example, -selfScrapeInterval=10s would enable self-scraping of /metrics page with 10 seconds interval.
There are officials Grafana dashboards for single-node VictoriaMetrics and clustered VictoriaMetrics. There is also an alternative dashboard for clustered VictoriaMetrics.
The most interesting metrics are:
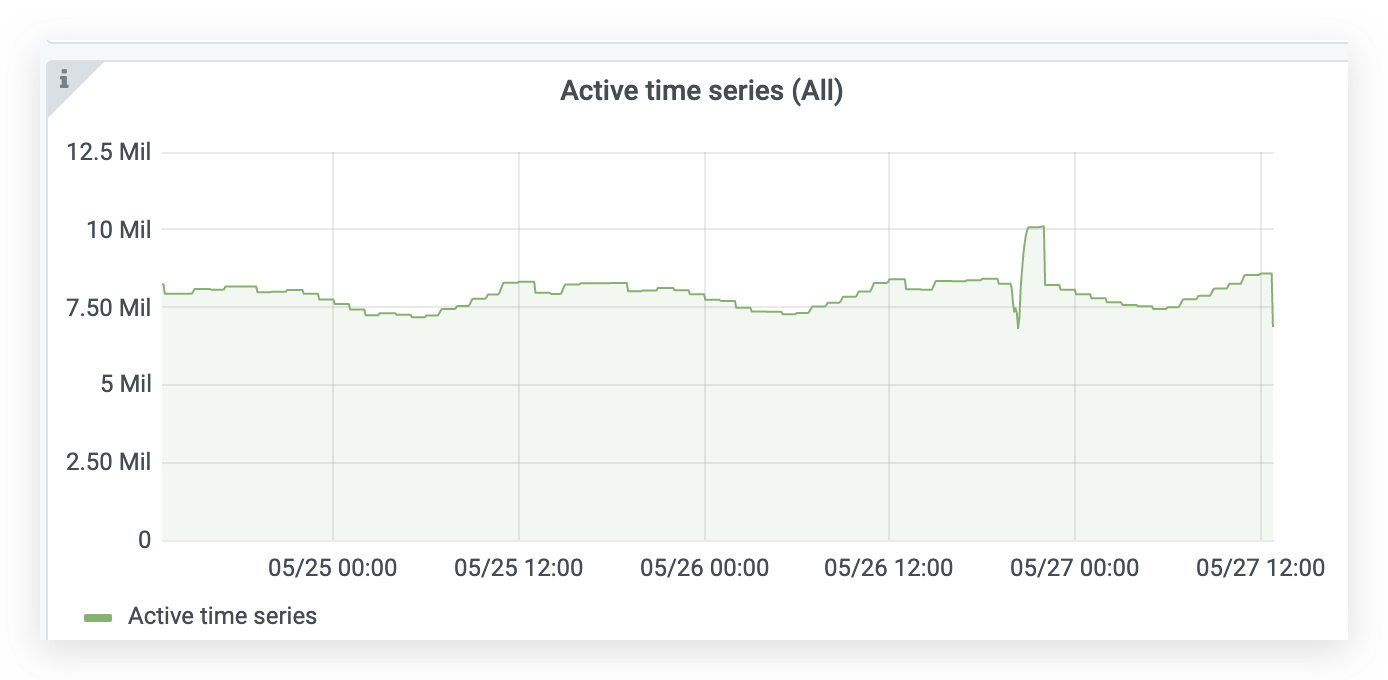
vm_cache_entries{type="storage/hour_metric_ids"}- the number of time series with new data points during the last hour aka active time series.increase(vm_new_timeseries_created_total[1h])- time series churn rate during the previous hour.sum(vm_rows{type=~"storage/.*"})- total number of(timestamp, value)data points in the database.sum(rate(vm_rows_inserted_total[5m]))- ingestion rate, i.e. how many samples are inserted int the database per second.vm_free_disk_space_bytes- free space left at-storageDataPath.sum(vm_data_size_bytes)- the total size of data on disk.increase(vm_slow_row_inserts_total[5m])- the number of slow inserts during the last 5 minutes. If this number remains high during extended periods of time, then it is likely more RAM is needed for optimal handling of the current number of active time series.increase(vm_slow_metric_name_loads_total[5m])- the number of slow loads of metric names during the last 5 minutes. If this number remains high during extended periods of time, then it is likely more RAM is needed for optimal handling of the current number of active time series.
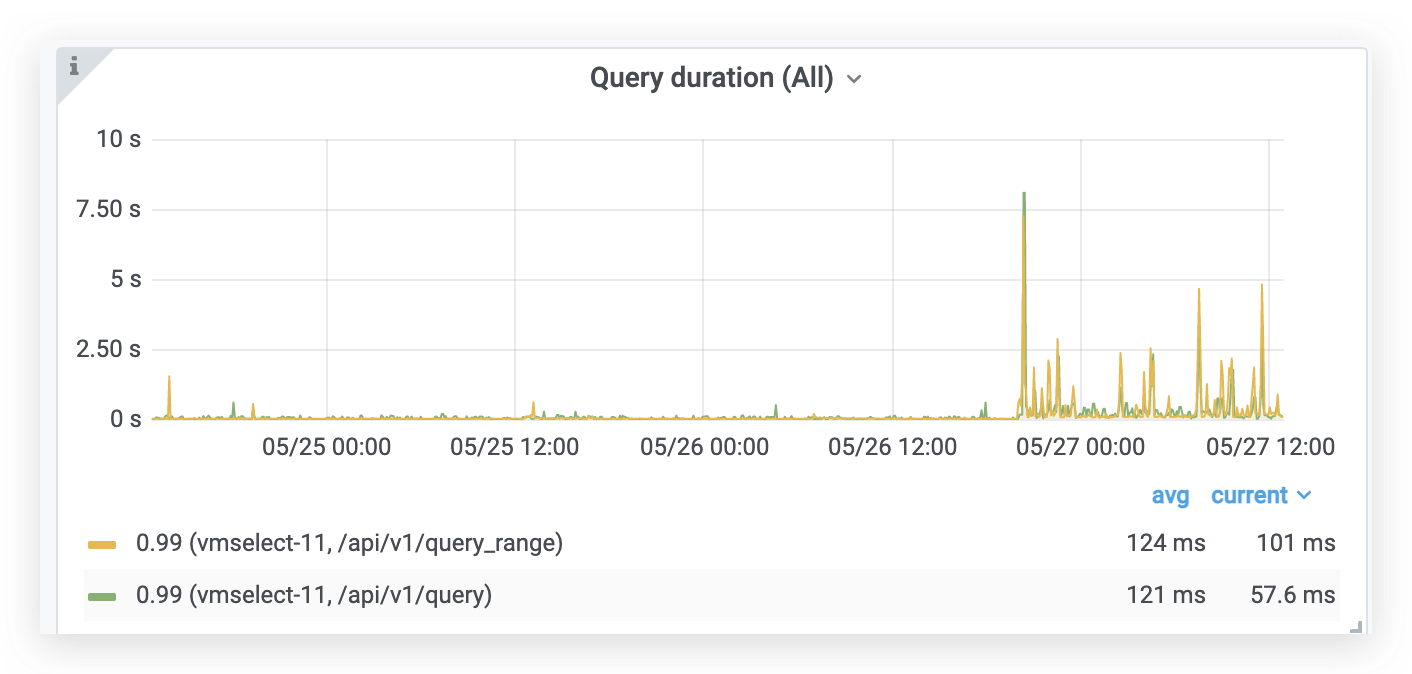
VictoriaMetrics also exposes currently running queries with their execution times at /api/v1/status/active_queries page.
See the example of alerting rules for VM components here.
Troubleshooting
-
It is recommended to use default command-line flag values (i.e. don't set them explicitly) until the need of tweaking these flag values arises.
-
It is recommended upgrading to the latest available release from this page, since the encountered issue could be already fixed there.
-
It is recommended inspecting logs during troubleshooting, since they may contain useful information.
-
VictoriaMetrics buffers incoming data in memory for up to a few seconds before flushing it to persistent storage. This may lead to the following "issues":
- Data becomes available for querying in a few seconds after inserting. It is possible to flush in-memory buffers to persistent storage by requesting
/internal/force_flushhttp handler. This handler is mostly needed for testing and debugging purposes. - The last few seconds of inserted data may be lost on unclean shutdown (i.e. OOM,
kill -9or hardware reset). See this article for technical details.
- Data becomes available for querying in a few seconds after inserting. It is possible to flush in-memory buffers to persistent storage by requesting
-
If VictoriaMetrics works slowly and eats more than a CPU core per 100K ingested data points per second, then it is likely you have too many active time series for the current amount of RAM. VictoriaMetrics exposes
vm_slow_*metrics, which could be used as an indicator of low amounts of RAM. It is recommended increasing the amount of RAM on the node with VictoriaMetrics in order to improve ingestion and query performance in this case. -
VictoriaMetrics prioritizes data ingestion over data querying. So if it has no enough resources for data ingestion, then data querying may slow down significantly.
-
VictoriaMetrics requires free disk space for merging data files to bigger ones. It may slow down when there is no enough free space left. So make sure
-storageDataPathdirectory has at least 20% of free space comparing to disk size. The remaining amount of free space can be monitored viavm_free_disk_space_bytesmetric. The total size of data stored on the disk can be monitored via sum ofvm_data_size_bytesmetrics. See alsovm_merge_need_free_disk_spacemetrics, which are set to values higher than 0 if background merge cannot be initiated due to free disk space shortage. The value shows the number of per-month partitions, which would start background merge if they had more free disk space. -
If VictoriaMetrics doesn't work because of certain parts are corrupted due to disk errors, then just remove directories with broken parts. It is safe removing subdirectories under
<-storageDataPath>/data/{big,small}/YYYY_MMdirectories when VictoriaMetrics isn't running. This recovers VictoriaMetrics at the cost of data loss stored in the deleted broken parts. In the future,vmrecovertool will be created for automatic recovering from such errors. -
If you see gaps on the graphs, try resetting the cache by sending request to
/internal/resetRollupResultCache. If this removes gaps on the graphs, then it is likely data with timestamps older than-search.cacheTimestampOffsetis ingested into VictoriaMetrics. Make sure that data sources have synchronized time with VictoriaMetrics.If the gaps are related to irregular intervals between samples, then try adjusting
-search.minStalenessIntervalcommand-line flag to value close to the maximum interval between samples. -
If you are switching from InfluxDB or TimescaleDB, then take a look at
-search.maxStalenessIntervalcommand-line flag. It may be needed in order to suppress default gap filling algorithm used by VictoriaMetrics - by default it assumes each time series is continuous instead of discrete, so it fills gaps between real samples with regular intervals. -
Metrics and labels leading to high cardinality or high churn rate can be determined at
/api/v1/status/tsdbpage. See these docs for details. VictoriaMetrics accepts optionaldate=YYYY-MM-DDandtopN=42args on this page. By defaultdateequals to the current date, whiletopNequals to 10. -
VictoriaMetrics limits the number of labels per each metric with
-maxLabelsPerTimeseriescommand-line flag. This prevents from ingesting metrics with too many labels. It is recommended monitoringvm_metrics_with_dropped_labels_totalmetric in order to determine whether-maxLabelsPerTimeseriesmust be adjusted for your workload. -
If you store Graphite metrics like
foo.bar.bazin VictoriaMetrics, then use{__graphite__="foo.*.baz"}syntax for selecting such metrics. This expression is equivalent to{__name__=~"foo[.][^.]*[.]baz"}, but it works faster and it is easier to use when migrating from Graphite. -
VictoriaMetrics ignores
NaNvalues during data ingestion.
Data migration
Use vmctl for data migration. It supports the following data migration types:
- From Prometheus to VictoriaMetrics
- From InfluxDB to VictoriaMetrics
- From VictoriaMetrics to VictoriaMetrics
See vmctl docs for more details.
Backfilling
VictoriaMetrics accepts historical data in arbitrary order of time via any supported ingestion method. Make sure that configured -retentionPeriod covers timestamps for the backfilled data.
It is recommended disabling query cache with -search.disableCache command-line flag when writing historical data with timestamps from the past, since the cache assumes that the data is written with the current timestamps. Query cache can be enabled after the backfilling is complete.
An alternative solution is to query /internal/resetRollupResultCache url after backfilling is complete. This will reset the query cache, which could contain incomplete data cached during the backfilling.
Yet another solution is to increase -search.cacheTimestampOffset flag value in order to disable caching for data with timestamps close to the current time. Single-node VictoriaMetrics automatically resets response cache when samples with timestamps older than now - search.cacheTimestampOffset are ingested to it.
Data updates
VictoriaMetrics doesn't support updating already existing sample values to new ones. It stores all the ingested data points for the same time series with identical timestamps. While it is possible substituting old time series with new time series via removal of old time series and then writing new time series, this approach should be used only for one-off updates. It shouldn't be used for frequent updates because of non-zero overhead related to data removal.
Replication
Single-node VictoriaMetrics doesn't support application-level replication. Use cluster version instead. See these docs for details.
Storage-level replication may be offloaded to durable persistent storage such as Google Cloud disks.
See also high availability docs and backup docs.
Backups
VictoriaMetrics supports backups via vmbackup and vmrestore tools. We also provide vmbackuper tool for paid enterprise subscribers - see this issue for details.
Profiling
VictoriaMetrics provides handlers for collecting the following Go profiles:
- Memory profile. It can be collected with the following command:
curl -s http://<victoria-metrics-host>:8428/debug/pprof/heap > mem.pprof
- CPU profile. It can be collected with the following command:
curl -s http://<victoria-metrics-host>:8428/debug/pprof/profile > cpu.pprof
The command for collecting CPU profile waits for 30 seconds before returning.
The collected profiles may be analyzed with go tool pprof.
Integrations
- Helm charts for single-node and cluster versions of VictoriaMetrics.
- Kubernetes operator for VictoriaMetrics.
- netdata can push data into VictoriaMetrics via
Prometheus remote_write API. See these docs. - go-graphite/carbonapi can use VictoriaMetrics as time series backend. See this example.
- Ansible role for installing single-node VictoriaMetrics.
- Ansible role for installing cluster VictoriaMetrics.
- Snap package for VictoriaMetrics.
- vmalert-cli - a CLI application for managing vmalert.
Third-party contributions
- Unofficial yum repository (source code)
- Prometheus -> VictoriaMetrics exporter #1
- Prometheus -> VictoriaMetrics exporter #2
- Prometheus Oauth proxy - see this article for details.
Contacts
Contact us with any questions regarding VictoriaMetrics at [email protected].
Community and contributions
Feel free asking any questions regarding VictoriaMetrics:
If you like VictoriaMetrics and want to contribute, then we need the following:
- Filing issues and feature requests here.
- Spreading a word about VictoriaMetrics: conference talks, articles, comments, experience sharing with colleagues.
- Updating documentation.
We are open to third-party pull requests provided they follow KISS design principle:
- Prefer simple code and architecture.
- Avoid complex abstractions.
- Avoid magic code and fancy algorithms.
- Avoid big external dependencies.
- Minimize the number of moving parts in the distributed system.
- Avoid automated decisions, which may hurt cluster availability, consistency or performance.
Adhering KISS principle simplifies the resulting code and architecture, so it can be reviewed, understood and verified by many people.
Reporting bugs
Report bugs and propose new features here.
Victoria Metrics Logo
Zip contains three folders with different image orientations (main color and inverted version).
Files included in each folder:
- 2 JPEG Preview files
- 2 PNG Preview files with transparent background
- 2 EPS Adobe Illustrator EPS10 files
Logo Usage Guidelines
Font used
- Lato Black
- Lato Regular
Color Palette
We kindly ask
- Please don't use any other font instead of suggested.
- There should be sufficient clear space around the logo.
- Do not change spacing, alignment, or relative locations of the design elements.
- Do not change the proportions of any of the design elements or the design itself. You may resize as needed but must retain all proportions.