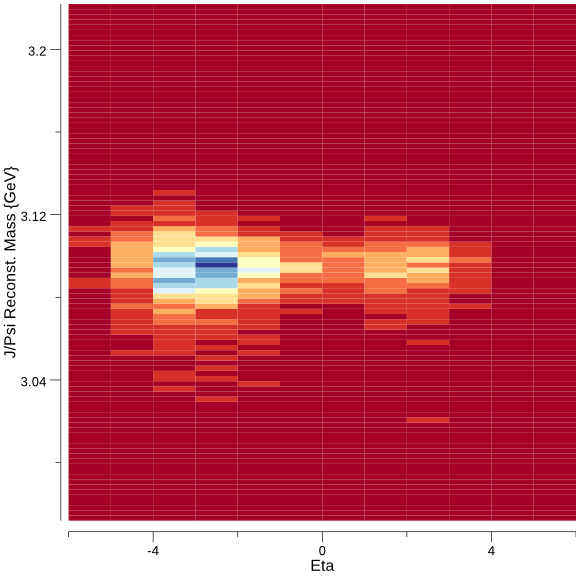
A repository for plotting and visualizing data

Gonum Plot

Build Status Build status Build status codecov.io coveralls.io GoDoc go.dev reference

gonum/plot is the new, official fork of code.google.com/p/plotinum. It provides an API for building and drawing plots in Go. Note that this new API is still in flux and may change. See the wiki for some example plots.

For additional Plotters, see the Community Plotters Wiki page.

There is a discussion list on Google Groups: [email protected].

gonum/plot is split into a few packages:

  • The plot package provides simple interface for laying out a plot and provides primitives for drawing to it.
  • The plotter package provides a standard set of Plotters which use the primitives provided by the plot package for drawing lines, scatter plots, box plots, error bars, etc. to a plot. You do not need to use the plotter package to make use of gonum/plot, however: see the wiki for a tutorial on making your own custom plotters.
  • The plotutil package contains a few routines that allow some common plot types to be made very easily. This package is quite new so it is not as well tested as the others and it is bound to change.
  • The vg package provides a generic vector graphics API that sits on top of other vector graphics back-ends such as a custom EPS back-end, draw2d, SVGo, X-Window, gopdf, and Gio.

Documentation

Documentation is available at:

https://godoc.org/gonum.org/v1/plot

Installation

You can get gonum/plot using go get:

go get gonum.org/v1/plot/...

If you write a cool plotter that you think others may be interested in using, please post to the list so that we can link to it in the gonum/plot wiki or possibly integrate it into the plotter package.

Owner
Consistent, composable, and comprehensible scientific code
null
Comments
  • Adds capability for colored scatter plots (issue #195)

    Adds capability for colored scatter plots (issue #195)

    I have closed the previous pull request, and created this one according to your comments @kortschak and @ctessum. Thanks!

    @ctessum I decided to send this PR anyway (and it's up to you, obviously, to accept it or not right now), so that at least the plot has this capability and it will fix the #195 issue. Meanwhile, I will start working on the alternative solution which you have proposed. It should definitely look much more elegant and be an improvement of the existing way of making scatter, scatter colour and bubble plots.

  • Creating a heatmap with 0 depth (min value == max value) causes panic

    Creating a heatmap with 0 depth (min value == max value) causes panic

    Converting depth / Z range into colorbar scaling generates a divide by 0 NaN.

    While 0 depth / flat heatmaps are not themselves meaningful, generating heatmaps on provided data sets can see cases where all values in the map are identically equal...

  • Liberation fonts

    Liberation fonts

    First stab at embedding Liberation fonts.

    The embedded asset is generated by running go generate ./vg/fonts vg/fonts/mk-fonts.go downloads a version of the liberation fonts from Fedora, untars it somewhere and runs go-bindata -o liberation_fonts_generated.go

    The increase in size for a given binary (the histogram test) is as follows:

    run-hist-old  8458416
    run-hist-new 10809200
    

    perhaps we could recoup some space by having people import _ "gonum.org/plot/vg/fonts" using the same kind of mechanism than database/sql's Driver ? In that case, perhaps it would be better to have the Liberation fonts live under "gonum.org/plot/vg/fonts/liberation" and put the fonts registration mechanism under "vg/fonts" But this would require client's code modification... (a relatively simple one, but still...)

    Also, there is a fair amount of test-files updates... could someone make sure I haven't made any mistake? (the Liberation fonts are somewhat different in height.)

    Fixes #107

  • added method for canvas tiles; changed plotter examples to tiles

    added method for canvas tiles; changed plotter examples to tiles

    I've created a method for tiling the canvas to make subfigures, and I have also changed the plotter examples to be put into subfigures instead of a bunch of individual files. PTAL.

  • vgsvg: express font size in px units, not points

    vgsvg: express font size in px units, not points

    We need to properly scale the fonts size relative to the graphs size.

    Currently, the size of the graph (lines, glyphs) is expressed in "user unit" (px), and the font size in point units (pt).

    The size of text relative to the graph would vary with different dpi.

    The suggested solution is to express font size in px, which is the same as without unit. This will require to define a scaling factor involving c.dpi.

    This is with current master.

  • plot: fix axis labelling

    plot: fix axis labelling

    This goes a long way towards fixing #403, though there are problems that I believe are a result of aggressive cropping of the plot space after the axes have been decided (the axes that show up here with only one major tick mark do have the labels created, but the plot does not end up rendering them).

    @eaburns Can you suggest anything here?

    /cc @decibelcooper

  • Update freetype imports

    Update freetype imports

    Looks like code.google.com/p/freetype-go redirects to github.com/golang/freetype now. This fixes go get for this project, but some dependent projects like draw2d may still refer to the old path.

  • plotter: plotting an histogram in logscale

    plotter: plotting an histogram in logscale

    hi,

    consider the following code:

    func TestHistogramLogScale(t *testing.T) {
    	rnd := rand.New(rand.NewSource(1))
    	n := 1000
    	vals := make(Values, n)
    	for i := 0; i < n; i++ {
    		vals[i] = rnd.NormFloat64()
    	}
    
    	p, err := plot.New()
    	if err != nil {
    		log.Panic(err)
    	}
    	p.Title.Text = "Histogram in logy"
    	p.Y.Min = 0.1
    	p.Y.Scale = plot.LogScale{}
    	p.Y.Tick.Marker = plot.LogTicks{}
    
    	h, err := NewHist(vals, 16)
    	if err != nil {
    		t.Fatal(err)
    	}
    	h.Normalize(1)
    	p.Add(h)
    
    	err = p.Save(200, 200, "testdata/histogram_log.png")
    	if err != nil {
    		t.Fatal(err)
    	}
    }
    

    this will panic:

    === RUN   TestHistogramLogScale
    --- FAIL: TestHistogramLogScale (0.01s)
    panic: Values must be greater than 0 for a log scale. [recovered]
    	panic: Values must be greater than 0 for a log scale.
    
    goroutine 5 [running]:
    testing.tRunner.func1(0xc42005a9c0)
    	/usr/lib/go/src/testing/testing.go:622 +0x29d
    panic(0x7d7160, 0xc4200f7790)
    	/usr/lib/go/src/runtime/panic.go:489 +0x2cf
    github.com/gonum/plot.LogTicks.Ticks(0x0, 0x3fda71c2dac35ff2, 0xc420123420, 0x4cbec8, 0x857cfb)
    	/home/binet/work/gonum/src/github.com/gonum/plot/axis.go:429 +0x400
    github.com/gonum/plot.(*LogTicks).Ticks(0xc89e68, 0x0, 0x3fda71c2dac35ff2, 0x4cc5a5, 0x857cfb, 0x9)
    	<autogenerated>:42 +0x5d
    github.com/gonum/plot.(*verticalAxis).size(0xc420123af8, 0x40278e0000000000)
    	/home/binet/work/gonum/src/github.com/gonum/plot/axis.go:282 +0x7a
    github.com/gonum/plot.(*Plot).Draw(0xc4200b3000, 0x7f6fa2e5d428, 0xc420058de0, 0x0, 0x0, 0x4069000000000000, 0x406712b000000000)
    	/home/binet/work/gonum/src/github.com/gonum/plot/plot.go:168 +0x232
    github.com/gonum/plot.(*Plot).WriterTo(0xc4200b3000, 0x4069000000000000, 0x4069000000000000, 0x86945b, 0x3, 0x0, 0x400aa49aec34e97f, 0x1, 0xc4200f7190)
    	/home/binet/work/gonum/src/github.com/gonum/plot/plot.go:455 +0x143
    github.com/gonum/plot.(*Plot).Save(0xc4200b3000, 0x4069000000000000, 0x4069000000000000, 0x869444, 0x1a, 0x0, 0x0)
    	/home/binet/work/gonum/src/github.com/gonum/plot/plot.go:481 +0x147
    github.com/gonum/plot/plotter.TestHistogramLogScale(0xc42005a9c0)
    	/home/binet/work/gonum/src/github.com/gonum/plot/plotter/histogram_test.go:129 +0x42b
    testing.tRunner(0xc42005a9c0, 0x873468)
    	/usr/lib/go/src/testing/testing.go:657 +0x96
    created by testing.(*T).Run
    	/usr/lib/go/src/testing/testing.go:697 +0x2ca
    exit status 2
    

    because, even though p.Y.Min was set, the empty bins of the histogram will still be "evaluated".

    Locally, I have implemented a not completely satisfactory hack: implement "clipping" decorators for LogScale and LogTicks:

    type ClipScale struct {
    	Min  float64
    	Max  float64
    	Norm plot.Normalizer
    }
    
    func (cs ClipScale) Normalize(min, max, x float64) float64 {
    	min = math.Max(cs.Min, min)
    	max = math.Min(cs.Max, max)
    	switch {
    	case x < cs.Min:
    		x = cs.Min
    	case x > cs.Max:
    		x = cs.Max
    	}
    	return cs.Norm.Normalize(min, max, x)
    }
    
    var _ plot.Normalizer = ClipScale{}
    
    type ClipTicker struct {
    	Min    float64
    	Max    float64
    	Ticker plot.Ticker
    }
    
    var _ plot.Ticker = ClipTicker{}
    
    func (ct ClipTicker) Ticks(min, max float64) []plot.Tick {
    	min = math.Max(min, ct.Min)
    	max = math.Min(max, ct.Max)
    	return ct.Ticker.Ticks(min, max)
    }
    

    and with:

    		p.Y.Scale = ClipScale{p.Y.Min, math.Inf(+1), plot.LogScale{}}
    		p.Y.Tick.Marker = ClipTicker{p.Y.Min, math.Inf(+1), plot.LogTicks{}}
    

    but it's not competely satisfactory because then we get histo-bars for these empty bins: histogram_log
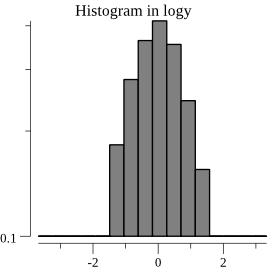
    any idea ?

  • axis: Incorrect positioning of tick marks new scheme

    axis: Incorrect positioning of tick marks new scheme

    Starting with commit e7f526d68a91a8b21c225cdbbbd8662d53c541f4, there is a problem with positioning and/or labeling of tick marks. The new scheme rounds tick labels, but the tick marks do not move to reflect this. The code could be changed to move the tick marks to reflect the labels, but this would ruin the regular tick mark positioning. I believe it fundamentally does not make sense to round the tick marks and/or labels.

    The problem is exemplified by this plot generated before and after the commit in question (using the go-hep.org hplot package which in-turn uses gonum plot), where the peak on the y axis is ideally 3.096:

    Before

    before

    After

    after

    One can see that in the After case, the vertical tick labels misrepresent the position of the peak.

  • vgx11: fix translate offset

    vgx11: fix translate offset

    Address issue #179 by translating the image to (0,-h) so (0,0) is at the bottom-left corner for the X11 backend.

    go test ./... will skip the X11 test if $DISPLAY is not defined.

  • Fonts are distributed as datafiles

    Fonts are distributed as datafiles

    Original issue 80 created by eaburns on 2012-09-20T16:12:32.000Z:

    If Plotinum is included with a program than that binary cannot be distributed to machines without the Plotinum source.

    A possible solution to this is to embed the data files into the Plotinum source. This may violate some GPL stuff, however...

  • vg/vggio seems broken with current release of gioui

    vg/vggio seems broken with current release of gioui

    I'm trying to use gonum plot with gio.

    I copied the example at https://github.com/gonum/plot/blob/master/vg/vggio/vggio_example_test.go and tried to run it somehow. The result when building is:

    Build Error: go build -o /Users/maygames/Projects/plottest/__debug_bin -gcflags all=-N -l .
    # gonum.org/v1/plot/vg/vggio
    ../../go/pkg/mod/gonum.org/v1/[email protected]/vg/vggio/context.go:36:13: undefined: op.StateOp
    ../../go/pkg/mod/gonum.org/v1/[email protected]/vg/vggio/context.go:45:23: undefined: op.Save
    ../../go/pkg/mod/gonum.org/v1/[email protected]/vg/vggio/context.go:63:12: cannot use f32.Pt(float32(x), float32(y)) (value of type "gioui.org/f32".Point) as type image.Point in argument to op.Offset
    ../../go/pkg/mod/gonum.org/v1/[email protected]/vg/vggio/vggio.go:231:15: undefined: clip.Dash
    ../../go/pkg/mod/gonum.org/v1/[email protected]/vg/vggio/vggio.go:241:3: unknown field 'Style' in struct literal of type clip.Stroke
    ../../go/pkg/mod/gonum.org/v1/[email protected]/vg/vggio/vggio.go:241:15: undefined: clip.StrokeStyle
    ../../go/pkg/mod/gonum.org/v1/[email protected]/vg/vggio/vggio.go:243:16: undefined: clip.FlatCap
    ../../go/pkg/mod/gonum.org/v1/[email protected]/vg/vggio/vggio.go:245:3: unknown field 'Dashes' in struct literal of type clip.Stroke
    ../../go/pkg/mod/gonum.org/v1/[email protected]/vg/vggio/vggio.go:260:9: clip.Outline{…}.Op().Add undefined (type clip.Op has no field or method Add)
    ../../go/pkg/mod/gonum.org/v1/[email protected]/vg/vggio/vggio.go:334:8: undefined: unit.Px
    ../../go/pkg/mod/gonum.org/v1/[email protected]/vg/vggio/vggio.go:245:3: too many errors (exit status 2)
    

    I ran

    go get -u
    go mod tidy
    

    but the result stays the same.

    Maybe I did not consider certain version dependencies. At the same time, it seems that vggio is not compatible with the current version of gio, or that the above mentioned example file maybe is outdated. Is there any fix available for this?

  • No tick numbers on a log axis plots

    No tick numbers on a log axis plots

    What are you trying to do?

    Plot data with labels on a log-log plot. Sometimes, no tick numbers are being displayed (depending on the data).

    What did you do?

    See a full example at: https://gist.github.com/tdegris/d1844e7c209d77962ecc891b47d3a04a

    Summary:

    	p := plot.New()
            [...]
    	p.X.Scale = plot.LogScale{}
    	p.X.Tick.Marker = plot.LogTicks{}
    	p.Y.Scale = plot.LogScale{}
    	p.Y.Tick.Marker = plot.LogTicks{}
    	p.Add(&plotter.Line{
    		XYs: data,
    		LineStyle: draw.LineStyle{ [...] },
    	})
    

    What did you expect to happen?

    Some numbers on the ticks of the Y axis.

    What actually happened?

    No tick numbers on the Y axis.

    noylabels

    What version of Go and Gonum/plot are you using?

    go version:

    go version go1.18.3 darwin/arm64
    

    gonum/plot version:

    /opt/homebrew/opt/go/pkg/mod/gonum.org/v1                                                                                                                         
    $ git rev-parse HEAD
    fba051f98f609634ae4392d0053ddfc627f8cdb3
    
  • plot: Align doesn't exactly align axes

    plot: Align doesn't exactly align axes

    as can be noticed from the produced plot in #732, (even with the 1:1 ratio), axes are not exactly aligned between plots (Y-axis for top-left/bottom-left, X-axis for bottom-left/bottom-right): rotated-canvas

    I've tested that with release up to v0.7.0 (so it's not a fall out from the "fonts revamp" work.) rot-v0 7 0

  • plot: consider implementing a rotated/transformed canvas

    plot: consider implementing a rotated/transformed canvas

    this has come up on slack. it would be great to be able to implement this kind of plot:

    • https://matplotlib.org/stable/gallery/axes_grid1/scatter_hist_locatable_axes.html#sphx-glr-gallery-axes-grid1-scatter-hist-locatable-axes-py plot

    to achieve this sort of thing, we need to be able to rotate a plot to tack it on the right hand side of the bottom left plot.

    the following program is an attempt at reproducing the same plot (sans the rotated canvas).

    package main
    
    import (
    	"flag"
    	"image/color"
    	"log"
    	"math/rand"
    	"os"
    
    	"gonum.org/v1/plot"
    	"gonum.org/v1/plot/plotter"
    	"gonum.org/v1/plot/vg"
    	"gonum.org/v1/plot/vg/draw"
    	"gonum.org/v1/plot/vg/vgimg"
    )
    
    func main() {
    	var ratio = flag.Bool("ratio", false, "apply a 1/3 ratio")
    	flag.Parse()
    
    	const (
    		rows = 2
    		cols = 2
    	)
    
    	var blue = color.RGBA{R: 24, G: 90, B: 169, A: 255}
    
    	ps := make([][]*plot.Plot, rows)
    	for i := range ps {
    		ps[i] = make([]*plot.Plot, cols)
    		for j := range ps[i] {
    			if i == 0 && j == 1 {
    				continue
    			}
    			ps[i][j] = plot.New()
    		}
    	}
    
    	const N = 1000
    	rnd := rand.New(rand.NewSource(1))
    	data := make(plotter.XYs, N)
    	xs := make(plotter.Values, N)
    	ys := make(plotter.Values, N)
    	for i := range data {
    		xs[i] = rnd.NormFloat64() * 2
    		ys[i] = rnd.NormFloat64()
    		data[i].X = xs[i]
    		data[i].Y = ys[i]
    	}
    
    	s, err := plotter.NewScatter(data)
    	if err != nil {
    		log.Panic(err)
    	}
    	s.GlyphStyle.Color = blue
    	s.GlyphStyle.Radius = vg.Points(3)
    
    	ps[1][0].Add(s)
    
    	// histo-x
    	hx, err := plotter.NewHist(xs, 20)
    	if err != nil {
    		log.Panic(err)
    	}
    	hx.FillColor = blue
    	hx.LineStyle.Color = blue
    
    	ps[0][0].Add(hx)
    
    	// histo-y
    	hy, err := plotter.NewHist(ys, 20)
    	if err != nil {
    		log.Panic(err)
    	}
    	hy.FillColor = blue
    	hy.LineStyle.Color = blue
    
    	ps[1][1].Add(hy)
    
    	const (
    		xsize = 30 * vg.Centimeter
    		ysize = 30 * vg.Centimeter
    	)
    	img := vgimg.New(xsize, ysize)
    	dc := draw.New(img)
    
    	const padding = 0.2 * vg.Centimeter
    	t := draw.Tiles{
    		Rows:      rows,
    		Cols:      cols,
    		PadTop:    padding,
    		PadBottom: padding,
    		PadRight:  padding,
    		PadLeft:   padding,
    		PadX:      padding,
    		PadY:      padding,
    	}
    
    	cs := plot.Align(ps, t, dc)
    
    	// aspect ratio.
    	if *ratio {
    		var (
    			top = &cs[0][0]
    			mid = &cs[1][0]
    			rhs = &cs[1][1]
    		)
    		top.Rectangle.Min.Y += 0.6 * top.Rectangle.Size().Y
    		top.Rectangle.Max.X += 0.6 * top.Rectangle.Size().X
    
    		mid.Rectangle.Max.Y += 0.6 * mid.Rectangle.Size().Y
    		mid.Rectangle.Max.X += 0.6 * mid.Rectangle.Size().X
    
    		rhs.Rectangle.Max.Y += 0.6 * rhs.Rectangle.Size().Y
    		rhs.Rectangle.Min.X += 0.6 * rhs.Rectangle.Size().X
    	}
    
    	ps[0][0].X.Tick.Marker = NoTicks{}
    	ps[1][1].Y.Tick.Marker = NoTicks{}
    
    	for j := 0; j < rows; j++ {
    		for i := 0; i < cols; i++ {
    			if ps[j][i] == nil {
    				continue
    			}
    			ps[j][i].Draw(cs[j][i])
    		}
    	}
    
    	w, err := os.Create("rotated-canvas.png")
    	if err != nil {
    		panic(err)
    	}
    	defer w.Close()
    
    	png := vgimg.PngCanvas{Canvas: img}
    	if _, err := png.WriteTo(w); err != nil {
    		panic(err)
    	}
    }
    
    // NoTicks implements plot.Ticker but does not display any tick.
    type NoTicks struct{}
    
    // Ticks returns Ticks in a specified range
    func (NoTicks) Ticks(min, max float64) []plot.Tick {
    	return nil
    }
    

    rotated-canvas

  • plot: test glyphboxes for plain and latex handlers

    plot: test glyphboxes for plain and latex handlers

    working on https://github.com/gonum/plot/pull/708 uncovered a slew of bugs related to plot.GlyphBox{,er}. we should probably test more thoroughly the various modes in which plot.GlyphBoxes are involved:

    • [ ] with a text.Plain handler (the default)
    • [ ] with a text.Latex handler
    • [ ] with and without a plot.Plot.Title
    • [ ] with and without a plot.Plot.{X,Y}.Label
    • [ ] with and without rotated labels, title and legend entries (#722, #724)
    • [ ] with and without a centered plot.Plot.{X,Y}.Label (+ rotated or not?) (#723)
  • plot: glyphbox for Legend

    plot: glyphbox for Legend

    plot.Legend doesn't implement plot.GlyphBoxer. It probably should so we don't unadvertantly cut off some of its symbols or glyphs.

    one should check the display of testdata/legend_standalone_golden.png as noted in https://github.com/gonum/plot/pull/708#issuecomment-869558221.

Related tags
Publish Your GIS Data(Vector Data) to PostGIS and Geoserver

GISManager Publish Your GIS Data(Vector Data) to PostGIS and Geoserver How to install: go get -v github.com/hishamkaram/gismanager Usage: testdata fol

Sep 26, 2022
General purpose library for reading, writing and working with OpenStreetMap data

osm This package is a general purpose library for reading, writing and working with OpenStreetMap data in Go (golang). It has the ability to read OSM

Dec 30, 2022
An API which allows you to upload an image and responds with the same image, stripped of EXIF data

strip-metadata This is an API which allows you to upload an image and responds with the same image, stripped of EXIF data. How to run You need to have

Nov 25, 2021
Decode embedded EXIF meta data from image files.

goexif Provides decoding of basic exif and tiff encoded data. Still in alpha - no guarantees. Suggestions and pull requests are welcome. Functionality

Dec 17, 2022
Efficient moving window for high-speed data processing.

Moving Window Data Structure Copyright (c) 2012. Jake Brukhman. ([email protected]). All rights reserved. See the LICENSE file for BSD-style license. I

Sep 4, 2022
Super fast static photo and video gallery generator (written in Go and HTML/CSS/native JS)

fastgallery Fast static photo and video gallery generator Super fast (written in Go and C, concurrent, uses fastest image/video libraries, 4-8 times f

Dec 4, 2022
Go bindings for audio capture and playback with ALSA and libasound

Go ALSA bindings These bindings allow capture and playback of audio via ALSA using the alsa-lib library. Installation go get github.com/cocoonlife/goa

Nov 26, 2022
This is old and unmaintained code, ignore it. starfish is a simple, SDL based, 2D graphics and user input library for Go. If you intend to work on it, please fork from the 'devel' branch, not 'master'. Current release: 0.12.0

What is starfish? What starfish is: starfish is a simple 2D graphics and user input library for Go built on SDL. What starfish is not: While it is bui

Jun 4, 2019
darkroom - An image proxy with changeable storage backends and image processing engines with focus on speed and resiliency.

Darkroom - Yet Another Image Proxy Introduction Darkroom combines the storage backend and the image processor and acts as an Image Proxy on your image

Dec 6, 2022
Go package captcha implements generation and verification of image and audio CAPTCHAs.

Package captcha ⚠️ Warning: this captcha can be broken by advanced OCR captcha breaking algorithms. import "github.com/dchest/captcha" Package captch

Dec 30, 2022
Fast and secure standalone server for resizing and converting remote images

imgproxy imgproxy is a fast and secure standalone server for resizing and converting remote images. The main principles of imgproxy are simplicity, sp

Jan 1, 2023
Real-time Geospatial and Geofencing

Tile38 is an open source (MIT licensed), in-memory geolocation data store, spatial index, and realtime geofence. It supports a variety of object types

Jan 4, 2023
Image processing library and rendering toolkit for Go.

blend Image processing library and rendering toolkit for Go. (WIP) Installation: This library is compatible with Go1. go get github.com/phrozen/blend

Nov 11, 2022
Struct for marshaling and unmarshaling glTF

glTF Struct for marshaling and unmarshaling glTF go get github.com/sturfeeinc/glTF/model It's autogenerated code from official work group's specs. Don

Apr 5, 2020
A lightning fast image processing and resizing library for Go

govips A lightning fast image processing and resizing library for Go This package wraps the core functionality of libvips image processing library by

Jan 8, 2023
Go bindings for libVLC and high-level media player interface

Go bindings for libVLC 2.X/3.X/4.X and high-level media player interface. The package can be useful for adding multimedia capabilities to applications

Dec 31, 2022
Read and write Netpbm images from Go programs

netpbm Introduction netpbm is a package for the Go programming language that implements image decoders and encoders for the Netpbm image formats. The

Dec 29, 2022
A library to read, write, and transform Stereolithography (.stl) files in Go.

stl A library to read, write, and transform Stereolithography (.stl) files in Go. It is used in the command line STL manipulation tool stltool. Featur

Sep 26, 2022
ID3, MP4 and OGG/FLAC metadata parsing in Go

MP3/MP4/OGG/FLAC metadata parsing library This package provides MP3 (ID3v1,2.{2,3,4}) and MP4 (ACC, M4A, ALAC), OGG and FLAC metadata detection, parsi

Jan 7, 2023