WatchDogClient - WDC
WDC is a client application for WatchDog - wd, which is a tool to monitor and health check servers through plug-in scripts.
WDC listens to a remote alert server which broadcasts alert messages. The received alert will be logged to WDC/logs/ in user's home directory. It also comes with a local http server listening on port 8080 with an endpoint /{id} that can be used to get details of an alert given it's id. The same can be done via command line using the inspect command of wdc.
Intallation
go install github.com/opxyc/wdc@latest
Usage:
  wdc [command]

Available Commands:
  help        Help about any command
  inspect     Inspect an alert using it's ID
  listen      Start listening to incoming alerts
Start listening to alerts
$ wdc listen
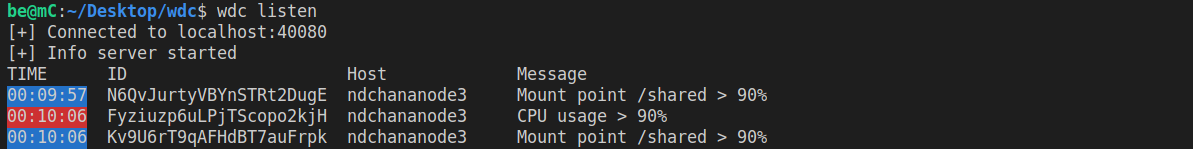
But default, wdc connects to localhost:40080 at endpoint /ws/connect.
Usage:
  wdc listen [flags]

Flags:
  -r, --addr string        network address of alert server (default "localhost:40080")
  -e, --end-point string   websocket connection endpoint of alert server (default "/ws/connect")
Inspecting an alert
$ wdc inspect ID
be@mC:~/Desktop/wdc$ wdc inspect PgKt664SLUxceGiuFhTGMn
ID             PgKt664SLUxceGiuFhTGMn
Time           2021-Oct-27 23:31:03
Hostname       dr-pg-l02
Task Name      mount-point-arc-check
Message        Mount point /arc > 90%
Status         OK (actions executed successfully)

Command output:
(mount-point-arc-check.out) current utilization 91.2%
(mount-point-arc-check.delete-archives.out) deleting archives
(mount-point-arc-check.delete-archives.out) current utilization 63.8%
You can also get the same info by visiting localhost:8080/{id}.
Log Structure
WDC logs into a new log file every day and hence inside UserHome/WDC/logs, there will be log files with name in the format yyyy-month-dd. Each alert is logged in the below format (with example).
// 2021/90/27 18:37:45
// rJeqKsiMECBUpCGG54YhgL                           👈 log id
// 2021-Oct-27 13:40:04	                            👈 the time alert was generated
// mC                                               👈 hostname
// cpu-usage-gt-90                                  👈 task name
// cpu usage on > 90%. take action immediately      👈 short msg
// (cpu-usage-gt-90.err) exit status 1              👈 long msg (combined output of the
// (cpu-usage-gt-90.out) current CPU usage is 15        cmd executed at wd client running on backend server)
// (cpu-usage-gt-90.stop-backup.err) exec: "bkpc stop":
// could not stop backup process; unresponding thread
// 1                                                👈 status code: 0 or 1
// ENDOFrJeqKsiMECBUpCGG54YhgL                      👈 end of one alert
If the terms taskname, message, cmd etc. is not clear, head to WD.