A horizontally scalable, highly available, multi-tenant, long term Prometheus.

Cortex Logo

CI GoDoc Go Report Card Slack

Cortex: horizontally scalable, highly available, multi-tenant, long term storage for Prometheus.

Cortex provides horizontally scalable, highly available, multi-tenant, long term storage for Prometheus.

  • Horizontally scalable: Cortex can run across multiple machines in a cluster, exceeding the throughput and storage of a single machine. This enables you to send the metrics from multiple Prometheus servers to a single Cortex cluster and run "globally aggregated" queries across all data in a single place.
  • Highly available: When run in a cluster, Cortex can replicate data between machines. This allows you to survive machine failure without gaps in your graphs.
  • Multi-tenant: Cortex can isolate data and queries from multiple different independent Prometheus sources in a single cluster, allowing untrusted parties to share the same cluster.
  • Long term storage: Cortex supports S3, GCS, Swift and Microsoft Azure for long term storage of metric data. This allows you to durably store data for longer than the lifetime of any single machine, and use this data for long term capacity planning.

Cortex is a CNCF incubation project used in several production systems including Weave Cloud and Grafana Cloud. Cortex is primarily used as a remote write destination for Prometheus, with a Prometheus-compatible query API.

Documentation

Read the getting started guide if you're new to the project. Before deploying Cortex with a permanent storage backend you should read:

  1. An overview of Cortex's architecture
  2. Getting started with Cortex
  3. Information regarding configuring Cortex

For a guide to contributing to Cortex, see the contributor guidelines.

Further reading

To learn more about Cortex, consult the following talks and articles.

Recent talks and articles

Previous talks and articles

Getting Help

If you have any questions about Cortex:

Your feedback is always welcome.

For security issues see https://github.com/cortexproject/cortex/security/policy

Community Meetings

The Cortex community call happens every two weeks on Thursday, alternating at 1200 UTC and 1700 UTC. To get a calendar invite join the google groups or check out the CNCF community calendar.

Meeting notes are held here.

Hosted Cortex (Prometheus as a service)

There are several commercial services where you can use Cortex on-demand:

Weave Cloud

Weave Cloud from Weaveworks lets you deploy, manage, and monitor container-based applications. Sign up at https://cloud.weave.works and follow the instructions there. Additional help can also be found in the Weave Cloud documentation.

Instrumenting Your App: Best Practices

Grafana Cloud

The Cortex project was started by Tom Wilkie (Grafana Labs' VP Product) and Julius Volz (Prometheus' co-founder) in June 2016. Employing 6 out of 8 maintainers for Cortex enables Grafana Labs to offer Cortex-as-a-service with exceptional performance and reliability. As the creators of Grafana, Loki, and Tempo, Grafana Labs can offer you the most wholistic Observability-as-a-Service stack out there.

For further information see Grafana Cloud documentation, tutorials, webinars, and KubeCon talks. Get started today and sign up here.

Amazon Managed Service for Prometheus (AMP)

Amazon Managed Service for Prometheus (AMP) is a Prometheus-compatible monitoring service that makes it easy to monitor containerized applications at scale. It is a highly available, secure, and managed monitoring for your containers. Get started here. To learn more about the AMP, reference our documentation and Getting Started with AMP blog.

Owner
Cortex
A multitenant, horizontally scalable Prometheus as a Service
Cortex
Comments
  • Add ElasticSearch as a new Index Client

    Add ElasticSearch as a new Index Client

    Currently Cortex only support GCP, AWS Dynamo, Cassandra for Chunk Index. Here add a new choice, which is ElasticSearch since it's a very popular NoSQL storage.

    Implement Hint: Only write some new go code in pkg/chunk/elastic, other file changes are introduced by go mod tidy and go mod vendor.

    Sample Config to Use ElasticSearch in https addr(will skip tls verify by default, user can change it with passing some config) and http addr:

    schema_config:
            configs:
            - from: 2018-04-15
              store: elastic
              object_store: s3
              schema: v9
              index:
                prefix: index_
                period: 168h
    
          storage_config:
            elastic:
              address: https://es_addr:443
              user: user
              password: password
    

    or

    schema_config:
            configs:
            - from: 2018-04-15
              store: elastic
              object_store: s3
              schema: v9
              index:
                prefix: index_
                period: 168h
    
          storage_config:
            elastic:
              address: https://es_addr:443
              user: user
              password: password
              tls_skip_verify: false
              cert_file: cert_file_addr
              key_file: key_file_addr
              ca_file: ca_file
    

    and

    schema_config:
            configs:
            - from: 2018-04-15
              store: elastic
              object_store: s3
              schema: v9
              index:
                prefix: index_
                period: 168h
    
          storage_config:
            elastic:
              address: http://es_addr
    
  • How is the Query Frontend supposed to be configured?

    How is the Query Frontend supposed to be configured?

    Description

    I'm running a 3 node Cortex 1.4.0 cluster with -target=all and I'm seeing pretty bad query performance in Grafana. I figured my issue is not using the Query Frontend to parallelize the queries. But the documentation is quite confusing.

    You can find a config of one of my nodes here.

    Details

    Based on the docs:

    The query frontend is an optional service providing the querier’s API endpoints and can be used to accelerate the read path.

    But if we check -modules we see that frontend is not optional, but rather included in the all target:

     > cortex -modules | grep frontend
    query-frontend *
    

    Which means I'm already running a query-frontend service on each node:

     > curl -s 'http://localhost:9092/services' | grep -A1 query-frontend
    					<td>query-frontend</td>
    					<td>Running</td>
    

    But my query performance is very bad, so I thought that maybe I'm using the wrong endpoint. But when I checked the codebase I could not identify any special path prefix for the query-frontend: https://github.com/cortexproject/cortex/blob/23554ce028c090a4a3413ac0e35e5e1dc9fa929f/pkg/api/api.go#L414-L420 It seems to me like query-frontend is already available under the PrometheusHTTPPrefix path which is /prometheus.

    I found this comment: https://github.com/cortexproject/cortex/issues/2921#issuecomment-662998729

    If you're running the query-frontend in front of a Cortex cluster, the suggested way is not using the downstream URL but configuring the querier worker to connect to the query-frontend (and here we do support SRV records).

    Which suggests that my configuration should have the querier talk to the query-frontend. But how is that supposed to work if I have multiple query-frontends, one for each Cortex instance? Should each Cortex instance querier have it's own query-frontend configured as frontend_worker.frontend_address?

    Another thing is, why is the flag called -querier.frontend-address but the config option is frontend_worker.frontend_address?

    Or should I run a separate -target=query-frontend instance of Cortex on a separate host(probably same as my Grafana) and have the querier services connect to that single query-frontend?

  • Alertmanager fails to read fallback config

    Alertmanager fails to read fallback config

    Description

    I'm trying to use fallback_config_file with Alertmanager service but it fails with:

     msg="GET /api/prom/configs/alertmanager (500) 78.226µs Response: \"Failed to initialize the Alertmanager\\n\"
    

    Details

    I'm running 1.4.0 binary release form GitHub and I have fallback_config_file configured to point to a file I configured the same way I used to for normal Alertmanager. When I check the logs I do not see either of these two errors: https://github.com/cortexproject/cortex/blob/23554ce028c090a4a3413ac0e35e5e1dc9fa929f/pkg/alertmanager/multitenant.go#L186 https://github.com/cortexproject/cortex/blob/23554ce028c090a4a3413ac0e35e5e1dc9fa929f/pkg/alertmanager/multitenant.go#L190 But when I query the API:

    curl -sv http://localhost:9101/api/prom/configs/alertmanager -H 'X-Scope-OrgID: 0'
    

    I get back:

    Failed to initialize the Alertmanager
    

    But the code that triggers this error doesn't actually show what caused it because err is discarded: https://github.com/cortexproject/cortex/blob/23554ce028c090a4a3413ac0e35e5e1dc9fa929f/pkg/alertmanager/multitenant.go#L476-L485 So I have no clue what I'm doing wrong. The file is in place, it has read permissions for the service.

  • New ingesters not ready if there's a faulty ingester in the ring

    New ingesters not ready if there's a faulty ingester in the ring

    The ingester readiness endpoint fails on ingester startup if there's a unhealthy ingester within this ring. This looks to create some confusion to users (eg. https://github.com/cortexproject/cortex/issues/2913) and I'm also not much sure of this logic makes sense when running Cortex chunks storage with WAL or the Cortex blocks storage.

    I'm opening this PR to have a discussion about it. In particular:

    1. Why this check was introduced?
    2. What would happen if we remove it?
  • Cortex return 5xx due a single ingester outage

    Cortex return 5xx due a single ingester outage

    Describe the bug Cortex can return 5xx due a single ingester failure when a tenant is being throttled (4xx). In this case, distributor can return the error from the bad ingester (5xx) even though the other 2 returned 4xx. See this.

    Looking at this code seems that if we have replication factor = 2, 1 ingester down and the other 2 returning 4xx we can have for example:

    4xx + 5xx + 4xx = 5xx or 5xx + 4xx + 4xx = 4xx etc

    To Reproduce Steps to reproduce the behavior: I could create a unit test that reproduce the behavior: https://github.com/alanprot/cortex/commit/fd36d97e010f93e28db21e3a1e981e17cd281a80

    1. Start Cortex (SHA or version) a4bf1035478641626fcbdd5fd12325c08a2bba76
    2. Perform Operations(Read/Write/Others) Write Expected behavior Cortex should return the error respecting the quorum of the response from ingesters. So, if 2 ingesters return 4xx and one 5xx, cortex should return 4xx. This means that if distributor receive one 4xx and one 5xx, it needs to wait the response of the third ingester.

    Environment:

    • Infrastructure: [e.g., Kubernetes, bare-metal, laptop] Kubernetes
    • Deployment tool: [e.g., helm, jsonnet] Helm Storage Engine
    • [X] Blocks
    • [ ] Chunks

    Additional Context

  • Re-try addition of configurable trace sampling strategy

    Re-try addition of configurable trace sampling strategy

    EDIT: Please see #703 for description

    @JML - I'm not entirely sure that adding an override to Gopkg.toml was the proper fix, so if I got it wrong, let me know what the proper method is and I'll fix it up. :-)

    Thanks!

  • Are huge amounts of 'sample timestamp out of order' logs normal?

    Are huge amounts of 'sample timestamp out of order' logs normal?

    Description

    Every time I modify Cortex configuration and restart the nodes they generate ungodly amounts of logs like this:

    msg="push error" err="rpc error: code = Code(400) desc = user=fake: sample timestamp out of order; last timestamp: ...
    

    I assume this is because the upstream Prometheus instance is re-trying pushing of the metrics that failed when node was down.

    It generates quite a lot of them...

     > sudo journalctl -a -u cortex | grep 'sample timestamp out of order' | wc -l
    173476
    

    Questions

    • Is Cortex incapable of ingesting old metrics re-pushed by Prometheus? Or am I doing something wrong?
    • If Cortex is incapable of ingesting old metrics, why is this an error rather than a warning or even a debug message?
    • Can I stop this specific message from spamming my logs somehow?
  • Cortex can read rules but doesn't activate them

    Cortex can read rules but doesn't activate them

    Description

    I'm running 1.4.0 using the binary from GitHub and I have ruler configured to send alerts to my own cluster of Alertmanager.

    For a moment I saw the alerts in my Alertmanager Web UI, but shortly after they disappeared.

    Config

    My ruler section of the config looks like this:

    ruler:
      external_url: 'https://alerts.example.org/'
      alertmanager_url: 'http://localhost:9093/'
      enable_alertmanager_v2: true
      rule_path: '/var/tmp/cortex/rules'
      enable_api: true
      storage:
        type: local
        local:
          directory: '/etc/cortex/rules'
    

    My rules are located in /etc/cortex/rules/fale since I use auth_enabled: false.

    Debugging

    I can see the rules are located in the right place because I can look them up using the /api/v1/rules call:

     > curl -s 'http://localhost:9092/api/v1/rules' | head
    instance.yml:
        - name: instance
          rules:
            - alert: InstanceDown
              expr: up == 0
              for: 5m
              annotations:
                current_value: '{{ $value }}'
                description: '{{ $labels.instance }} of job {{ $labels.job }} has been down for more than 5 minutes.'
                summary: Instance {{ $labels.instance }} down
    

    But, when I try to use the /prometheus/api/v1/rules path I get nothing:

     > curl -s 'http://localhost:9092/prometheus/api/v1/rules' -H 'X-Scope-OrgID: fake' | jq .
    {
      "status": "success",
      "data": {
        "groups": []
      },
      "errorType": "",
      "error": ""
    }
    

    Even though just minutes ago I saw the rules displayed here. As well as the alerts generated by the rules. But now there's nothing there:

     > curl -s 'http://localhost:9092/prometheus/api/v1/alerts' -H 'X-Scope-OrgID: fake' | jq .
    {
      "status": "success",
      "data": {
        "alerts": []
      },
      "errorType": "",
      "error": ""
    }
    

    I'm confused as to what caused them to disappear. Restarting Cortex nodes doesn't fix the issue.

    Questions

    • My understanding is that ruler.rule_path is the place where Cortex checks for rule files. Correct?
    • My understanding is that ruler.storage.local.directory configures a temporary location for rule files. Correct?
    • Why can the rules be loaded from ruler.rule_path but are not available via /prometheus/api/v1/rules?
  • Distributor failing with 500s for no clear reason

    Distributor failing with 500s for no clear reason

    Describe the bug I'm seeing random 500s when Prometheus is pushing metrics to /api/v1/push:

    msg="Failed to send batch, retrying" err="server returned HTTP status 500 Internal Server Error: rpc error: code = Unavailable desc = transport is closing"
    

    Which looks like this on the Cortex side:

    msg="POST /api/v1/push (500) 281.388644ms Response: \"rpc error: code = Unavailable desc = transport is closing\\n\" ws: false; Content-Encoding: snappy; Content-Length: 32409; Content-Type: application/x-protobuf; User-Agent: Prometheus/2.26.0; X-Prometheus-Remote-Write-Version: 0.1.0; "
    

    But it's just a warn level message, and even with debug logs I see no reason for this error.

    The number of samples being sent is tiny:

     > curl -s localhost:9090/metrics | grep "^prometheus_tsdb_head_series "
    prometheus_tsdb_head_series 34294
    

    And the hosts are VERY beefy and underutilized, so I'm really confused why this is happening

    To Reproduce Not really sure. I'm happy to help debug this, but I'm not sure where to start.

    Expected behavior Error should include reason for 500 error, but all it contains is rpc error: code = Unavailable desc = transport is closing.

    Environment:

    • Infrastructure: Systemd service on Ubuntu
    • Version: 1.8.0

    Storage Engine Chunks storage using Cassandra 3.11.9.

    Additional Context I started getting a LOT of 500s suddenly, so I disabled all Prometheus instances except one to debug this, but the logs give me no indication as to why it's actually happening. When I re-enable all other Prometheus instances the 500s keep raising until they overwhelm Cortex. image

  • Ruler performance frequently degrades

    Ruler performance frequently degrades

    The ruler service in our cluster is frequently (every day) running into issues that end up meaning no rules are processed. The main issue seen is upper-percentile (90th percentile and above) ruler query time durations increase to 10 - 20 seconds, which causes the ruler to run into the group timeout (left at the default 10s in our cluster). Since we evaluate ~100 rules per tenant, these high percentile latencies cause every evaluation to fail.

    screen shot 2018-02-13 at 1 05 51 pm 
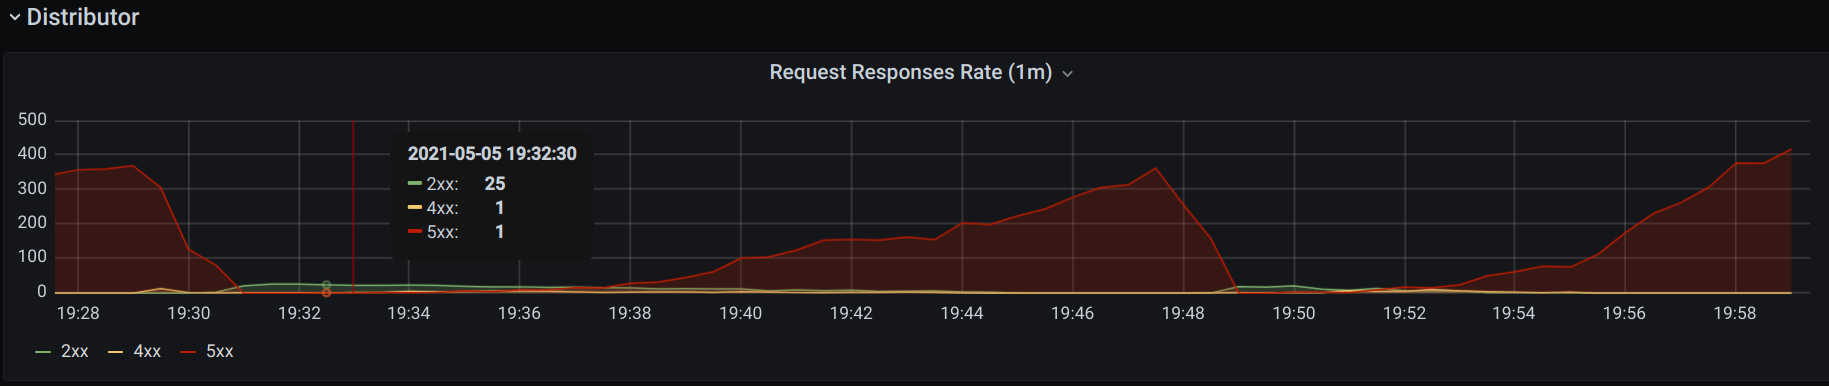
Queries for this graph look like:

    histogram_quantile(0.99, sum(rate(cortex_distributor_query_duration_seconds_bucket{name="ruler"}[1m])) by (le))
    

    Lots of log messages like:

    ts=2018-02-13T09:38:55.273063356Z caller=log.go:108 level=error org_id=0 msg="error in mergeQuerier.selectSamples" err="rpc error: code = DeadlineExceeded desc = context deadline exceeded"
    ts=2018-02-13T09:38:55.274565552Z caller=log.go:108 level=warn msg="context error" error="context deadline exceeded"
    
  • Current cortex_compactor_blocks_marked_for_no_compaction_total value is lost upon redeployment

    Current cortex_compactor_blocks_marked_for_no_compaction_total value is lost upon redeployment

    Describe the bug Cortex Compactor, upon pod redeployment, loses the current value of cortex_compactor_blocks_marked_for_no_compaction_total metric.

    This might or might not be affected by the fact, that currently I'm running Cortex 1.11.0 deployed via Cortex Helm Chart 1.4.0 with all bells and whistles (caches, key stores etc) but without Cortex Compactor pod. It's deployed separately and with minimum configuration possible. It's running cortex:master-bb6b026 version in order to incorporate https://github.com/cortexproject/cortex/commit/4d751f23f8de6bc871beac595f587f12ab588388 which introduced fix to compaction process which was blocking compaction in my env.

    To Reproduce Steps to reproduce the behavior:

    1. Deploy Cortex
    2. Start compactions
    3. Wait until some blocks are marked as no compaction and the metric cortex_compactor_blocks_marked_for_no_compaction_total starts showing value >0
    4. Redeploy the whole Cortex or Compactor pods only
    5. The metric shows 0 now (until new no compaction block is encountered)

    Expected behavior Current cortex_compactor_blocks_marked_for_no_compaction_total value is not lost upon Cortex redeployment

    Environment: GKE 1.21 Cortex 1.11.0 deployed via Cortex Helm Chart 1.4.0 (without compactor pod) Cortex Compactor cortex:master-bb6b026 deployed separately

    Storage Engine Blocks

    Additional Context n/a

  • Bug fix: ingesters returning empty response

    Bug fix: ingesters returning empty response

    Signed-off-by: 🌲 Harry 🌊 John 🏔 [email protected]

    What this PR does: Fixes an issue where the ingesters were returning empty response for metadata APIs.

    Which issue(s) this PR fixes: Fixes #

    Checklist

    • [X] Tests updated
    • [ ] Documentation added
    • [X] CHANGELOG.md updated - the order of entries should be [CHANGE], [FEATURE], [ENHANCEMENT], [BUGFIX]
  • Make TSDB max exemplars config per tenant

    Make TSDB max exemplars config per tenant

    Signed-off-by: sahnib [email protected]

    What this PR does:

    Makes TSDB max exemplars config per tenant. Note that the MaxExemplars value is passed down to prometheus tsdb at tsdb.Open call, hence this configuration would not be hot loaded at this time - unless the ingesters re-open the database handle, or go through a restart..

    Which issue(s) this PR fixes: Fixes #5016

    Checklist

    • [X] Tests updated
    • [X] Documentation added
    • [X] CHANGELOG.md updated - the order of entries should be [CHANGE], [FEATURE], [ENHANCEMENT], [BUGFIX]
  • Dynamic copy management to solve the problem of unbalanced load(mem) of Ingester nodes

    Dynamic copy management to solve the problem of unbalanced load(mem) of Ingester nodes

    Is your feature request related to a problem? Please describe.

    The current copy of Cortex is implemented through consistent hashing, and the location of the copy (Inageter node) is determined at the beginning of the metric data writing. In the case that some metric samples are relatively large, the load of different Ingester nodes will vary greatly.

    Describe the solution you'd like Whether we can implement dynamic replicas (shards), we can dynamically schedule between different Ingester nodes based on size, time slice, load, etc.

    Describe alternatives you've considered

    Additional context

  • Ingester: Limiting capability for uploading to object storage?

    Ingester: Limiting capability for uploading to object storage?

    Is your feature request related to a problem? Please describe. Currently, Ingester regularly uploads block data to object storage, which will occupy a large amount of write bandwidth, or even fill up the bandwidth. Have we considered peak clipping for uploads? This delay should be tolerable with the current design.

    Describe the solution you'd like The maximum upload flow limit can be configured to make data upload smoother.

    Describe alternatives you've considered

    Additional context

  • Rename oltp_endpoint to otlp_endpoint to match opentelemetry spec and lib name

    Rename oltp_endpoint to otlp_endpoint to match opentelemetry spec and lib name

    What this PR does: Renames oltp_endpoint to otlp_endpoint to match opentelemetry spec and lib name

    Which issue(s) this PR fixes: Fixes #5067

    Checklist

    • [x] Tests updated
    • [x] Documentation added
    • [x] CHANGELOG.md updated - the order of entries should be [CHANGE], [FEATURE], [ENHANCEMENT], [BUGFIX]
TiDB Mesh: Implement Multi-Tenant Keyspace by Decorating Message between Components

TiDB Mesh: Implement Multi-Tenant Keyspace by Decorating Message between Compone

Jan 11, 2022
Andrews-monitor - A Go program to monitor when times were available to order for Brown's Andrews dining hall. Used during the portion of the pandemic when the dining hall was only available for online order.

Andrews Dining Hall Monitor A Go program to monitor when times were available to order for Brown's Andrews dining hall. Used during the portion of the

Jan 1, 2022
A set of components that can be composed into a highly available metric system with unlimited storage capacity

Overview Thanos is a set of components that can be composed into a highly available metric system with unlimited storage capacity, which can be added

Oct 20, 2021
Open, Multi-Cloud, Multi-Cluster Kubernetes Orchestration

Karmada Karmada: Open, Multi-Cloud, Multi-Cluster Kubernetes Orchestration Karmada (Kubernetes Armada) is a Kubernetes management system that enables

Dec 30, 2022
Go WhatsApp Multi-Device Implementation in REST API with Multi-Session/Account Support

Go WhatsApp Multi-Device Implementation in REST API This repository contains example of implementation go.mau.fi/whatsmeow package with Multi-Session/

Dec 3, 2022
Export Prometheus metrics from journald events using Prometheus Go client library

journald parser and Prometheus exporter Export Prometheus metrics from journald events using Prometheus Go client library. For demonstration purposes,

Jan 3, 2022
Orchestra is a library to manage long running go processes.

Orchestra Orchestra is a library to manage long running go processes. At the heart of the library is an interface called Player // Player is a long ru

Oct 21, 2022
A long-running Go program that watches a Youtube playlist for new videos, and downloads them using yt-dlp or other preferred tool.

ytdlwatch A long-running Go program that watches a Youtube playlist for new videos, and downloads them using yt-dlp or other preferred tool. Ideal for

Jul 25, 2022
Asynchronously control the different roles available in the kubernetes cluster

RBAC audit Introduction This tool allows you to asynchronously control the different roles available in the kubernetes cluster. These audits are enter

Oct 19, 2021
PolarDB Stack is a DBaaS implementation for PolarDB-for-Postgres, as an operator creates and manages PolarDB/PostgreSQL clusters running in Kubernetes. It provides re-construct, failover swtich-over, scale up/out, high-available capabilities for each clusters.

PolarDB Stack开源版生命周期 1 系统概述 PolarDB是阿里云自研的云原生关系型数据库,采用了基于Shared-Storage的存储计算分离架构。数据库由传统的Share-Nothing,转变成了Shared-Storage架构。由原来的N份计算+N份存储,转变成了N份计算+1份存储

Nov 8, 2022
OCI drive, available from home

OCI Drive ... use your storage with Oracle Object Store Quick Start Make sure you have the Object Storage, bucket and you know the compartment id wher

Nov 10, 2021
:bento: Highly Configurable Terminal Dashboard for Developers and Creators

DevDash is a highly configurable terminal dashboard for developers and creators who want to choose and display the most up-to-date metrics they need,

Jan 3, 2023
Open Service Mesh (OSM) is a lightweight, extensible, cloud native service mesh that allows users to uniformly manage, secure, and get out-of-the-box observability features for highly dynamic microservice environments.

Open Service Mesh (OSM) Open Service Mesh (OSM) is a lightweight, extensible, Cloud Native service mesh that allows users to uniformly manage, secure,

Jan 2, 2023
Highly configurable prompt builder for Bash, ZSH and PowerShell written in Go.

Go Bullet Train (GBT) Highly configurable prompt builder for Bash, ZSH and PowerShell written in Go. It's inspired by the Oh My ZSH Bullet Train theme

Dec 17, 2022
A Golang based high performance, scalable and distributed workflow framework

Go-Flow A Golang based high performance, scalable and distributed workflow framework It allows to programmatically author distributed workflow as Dire

Jan 6, 2023
Resilient, scalable Brainf*ck, in the spirit of modern systems design

Brainf*ck-as-a-Service A little BF interpreter, inspired by modern systems design trends. How to run it? docker-compose up -d bash hello.sh # Should p

Nov 22, 2022
FaaSNet: Scalable and Fast Provisioning of Custom Serverless Container Runtimes at Alibaba Cloud Function Compute (USENIX ATC'21)

FaaSNet FaaSNet is the first system that provides an end-to-end, integrated solution for FaaS-optimized container runtime provisioning. FaaSNet uses l

Jan 2, 2023
Next generation recitation assignment tool for 6.033. Modular, scalable, fast

Next generation recitation assignment tool for 6.033. Modular, scalable, fast

Feb 3, 2022
Tigris is a modern, scalable backend for building real-time websites and apps.

Tigris Data Getting started These instructions will get you through setting up Tigris Data locally as Docker containers. Prerequisites Make sure that

Dec 27, 2022