gosivy - Real-time visualization tool for Go process metrics

gosivy

Release go.dev reference

Another visualization tool for Go process metrics.

Demo

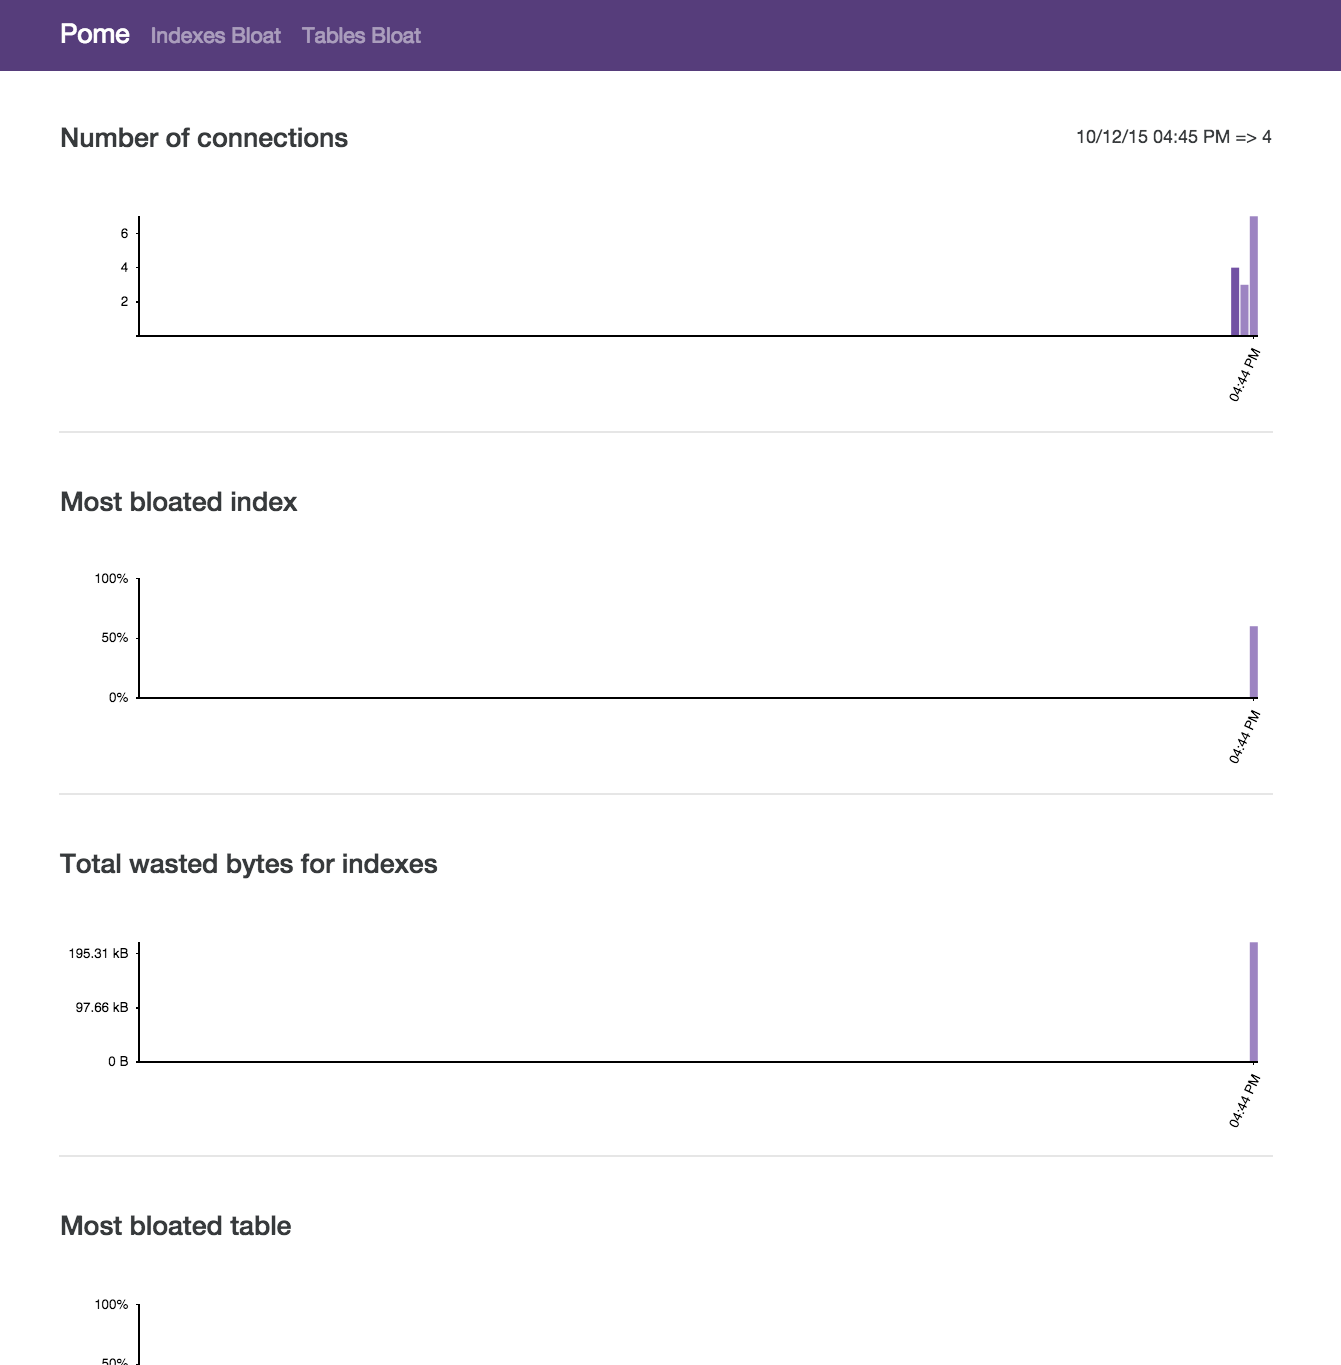
Gosivy tracks Go process's metrics and plot their evolution over time right into your terminal, no matter where it's running on. It helps you understand how your application consumes the resources.

Installation

Binary releases are available through here.

MacOS

brew install nakabonne/gosivy/gosivy

RHEL/CentOS

rpm -ivh https://github.com/nakabonne/gosivy/releases/download/v0.2.0/gosivy_0.2.0_linux_$(dpkg --print-architecture).rpm

Debian/Ubuntu

wget https://github.com/nakabonne/gosivy/releases/download/v0.2.0/gosivy_0.2.0_linux_$(dpkg --print-architecture).deb
apt install ./gosivy_0.2.0_linux_$(dpkg --print-architecture).deb

Go

Required: >= 1.10

go get github.com/nakabonne/gosivy

Quickstart

Unsure if Gosivy is for you? Watch Gosivy by using the example application.

Run the example application:

git clone https://github.com/nakabonne/gosivy.git && cd gosivy
go run examples/local/main.go

Then simply perform gosivy with no arguments (it automatically finds the process where the agent runs on):

gosivy

Press q to quit.

Usage

First up, you start the agent in the process where you want to collect statistics. Then execute gosivy to scrape from the agent periodically. You can diagnose processes running not only locally (local mode), but also on another host (remote mode).

Local Mode

Import github.com/nakabonne/gosivy/agent into the target application to launch the agent. See the local example.

package main

import "github.com/nakabonne/gosivy/agent"

func main() {
	if err := agent.Listen(agent.Options{}); err != nil {
		panic(err)
	}
	defer agent.Close()
}

With -l flag can list the processes where the agent runs on:

$ gosivy -l
PID   Exec Path
15788 foo  /path/to/foo

Give the PID of the process to be diagnosed:

$ gosivy 15788

Be sure to start the gosivy process as the same user as the target application.

Remote Mode

Give the address the agent listens on:

package main

import "github.com/nakabonne/gosivy/agent"

func main() {
	err := agent.Listen(agent.Options{
		Addr: ":9090",
	})
	if err != nil {
		panic(err)
	}
	defer agent.Close()
}

Specify the target's agent address accessible by the host where gosivy will be executed:

$ gosivy host.xz:9090

Settings

Command-line options are:

Usage:
  gosivy [flags] 

Flags:
      --debug                      Run in debug mode.
  -l, --list-processes             Show processes where gosivy agent runs on.
      --scrape-interval duration   Interval to scrape from the agent. It must be >= 1s (default 1s)
  -v, --version                    Print the current version.

Gosivy requires the config directory for pid management. By default it will be created undernearth $HOME/.config (APPDATA on windows). For those who want to assign another directory, GOSIVY_CONFIG_DIR environment variable is available.

Features

  • Simple - Show only minimal metrics.
  • Pull-based monitoring - The agent is designed to just listen on, so the target process does nothing unless you issue a request.
  • Wherever it's running on - Any process can be diagnosed as long as you can access the TCP socket the agent opens.

Supported Architectures

The architectures the agent can perform on are:

  • Darwin i386/amd64
  • Linux i386/amd64/arm(raspberry pi)
  • FreeBSD i386/amd64/arm
  • Windows/amd64
  • OpenBSD amd64
  • Solaris amd64

Those partially supported:

  • CPU on DragonFly BSD
  • host on Linux RISC-V

Built With

Inspired By

Author

Ryo Nakao <[email protected]>

Similar Resources

A Postgres Metrics Dashboard

A Postgres Metrics Dashboard

#Pome Pome stands for Postgres Metrics. Pome is a PostgreSQL Metrics Dashboard to keep track of the health of your database. This project is at a very

Dec 22, 2022

Very powerful server agent for collecting & sending logs & metrics with an easy-to-use web console.

Very powerful server agent for collecting & sending logs & metrics with an easy-to-use web console.

logkit-community 中文版 Introduce Very powerful server agent for collecting & sending logs & metrics with an easy-to-use web console. logkit-community De

Dec 29, 2022

Metrics dashboards on terminal (a grafana inspired terminal version)

Grafterm Visualize metrics dashboards on the terminal, like a simplified and minimalist version of Grafana for terminal. Features Multiple widgets (gr

Jan 6, 2023

gin-gonic/gin metrics for prometheus.

gin-gonic/gin  metrics for prometheus.

gin-metrics gin-gonic/gin metrics exporter for Prometheus. 中文 Introduction gin-metrics defines some metrics for gin http-server. There have easy way t

Jan 1, 2023

Pixie gives you instant visibility by giving access to metrics, events, traces and logs without changing code.

Pixie gives you instant visibility by giving access to metrics, events, traces and logs without changing code.

Pixie gives you instant visibility by giving access to metrics, events, traces and logs without changing code.

Jan 4, 2023

Go runtime metrics stack on your local computer.

Go runtime metrics stack on your local computer.

Goal This repository provides a docker-compose for Go runtime metrics stack on your local computer. It is using influxdb and grafana, it based on the

Oct 8, 2021

Go starter project with Gin, Viper, postgres , redis, zap, prometheus metrics etc setup

Go REST Service Starter/Boilerplate Easily extendible REST API Service boilerplate aiming to follow idiomatic go and best practice. Any feedback and p

Jun 23, 2022

Time based rotating file writer

cronowriter This is a simple file writer that it writes message to the specified format path. The file path is constructed based on current date and t

Dec 29, 2022

The Prometheus monitoring system and time series database.

Prometheus Visit prometheus.io for the full documentation, examples and guides. Prometheus, a Cloud Native Computing Foundation project, is a systems

Dec 31, 2022
Comments
  • Change catchphrase to avoid confusing

    Change catchphrase to avoid confusing

    "Yet another" implies that the list of things being counted is getting really long, and suggests a certain amount of impatience or irritation on the part of the speaker.

  • Reuse connections instead of creating each time

    Reuse connections instead of creating each time

    We'd better re-use one TCPConn again and again. https://github.com/nakabonne/gosivy/blob/97c565dc08809171a215b299aac397842dbe1519/diagnoser/diagnoser.go#L61-L64

  • Windows support

    Windows support

    For some reasons, cannot build for windows_amd64. gopsutil/process should support it but something wrong.

    release failed after 49.59s error=failed to build for windows_amd64: # github.com/shirou/gopsutil/process
    Error: ../../../go/pkg/mod/github.com/shirou/[email protected]+incompatible/process/process_windows.go:184:13: undefined: "golang.org/x/sys/windows".EnumProcesses
    
  • Use time as a data point of X-axis

    Use time as a data point of X-axis

    Currently it just counts up the numbers as data points of the X-axis, but it would be nice to be able to display the time.

    Refer to: https://github.com/slok/grafterm

Gowl is a process management and process monitoring tool at once. An infinite worker pool gives you the ability to control the pool and processes and monitor their status.

Gowl is a process management and process monitoring tool at once. An infinite worker pool gives you the ability to control the pool and processes and monitor their status.

Nov 10, 2022
A flexible process data collection, metrics, monitoring, instrumentation, and tracing client library for Go

Package monkit is a flexible code instrumenting and data collection library. See documentation at https://godoc.org/gopkg.in/spacemonkeygo/monkit.v3 S

Dec 14, 2022
pprof is a tool for visualization and analysis of profiling data

Introduction pprof is a tool for visualization and analysis of profiling data. pprof reads a collection of profiling samples in profile.proto format a

Jan 8, 2023
Visualise Go program GC trace data in real time

This project is no longer maintained I'm sorry but I do not have the bandwidth to maintain this tool. Please do not send issues or PRs. Thank you. gcv

Dec 14, 2022
Feb 9, 2022
Log-generator - A simple CLI tool that generates near real logs for testing

Log-generator - A simple CLI tool that generates near real logs for testing

Jan 22, 2022
exo: a process manager & log viewer for dev
 exo: a process manager & log viewer for dev

exo: a process manager & log viewer for dev exo- prefix – external; from outside. Features Procfile compatible process manager.

Dec 28, 2022
Monitor a process and trigger a notification.

noti Monitor a process and trigger a notification. Never sit and wait for some long-running process to finish. Noti can alert you when it's done. You

Jan 3, 2023
Rdebug — Real Debugger

RDebug - Real Debugger Translation 中文 1. Introduction Rdebug is an open source tool chain that focusing on efficiency of daily developing, testing and

Dec 23, 2022
Hard Drive S.M.A.R.T Monitoring, Historical Trends & Real World Failure Thresholds

Hard Drive S.M.A.R.T Monitoring, Historical Trends & Real World Failure Thresholds

Jan 1, 2023