Microservice observability with Go

micro-obs

Build Status Go Report Card

Contents

Overview

Example of instrumenting a Go microservices application:

  • Structured logging via zap
  • Automatic endpoint monitoring exposing metrics to Prometheus
  • Internal & distributed tracing via Jaeger

Deployments can be made via Docker and on Kubernetes. Additional instrumentation:

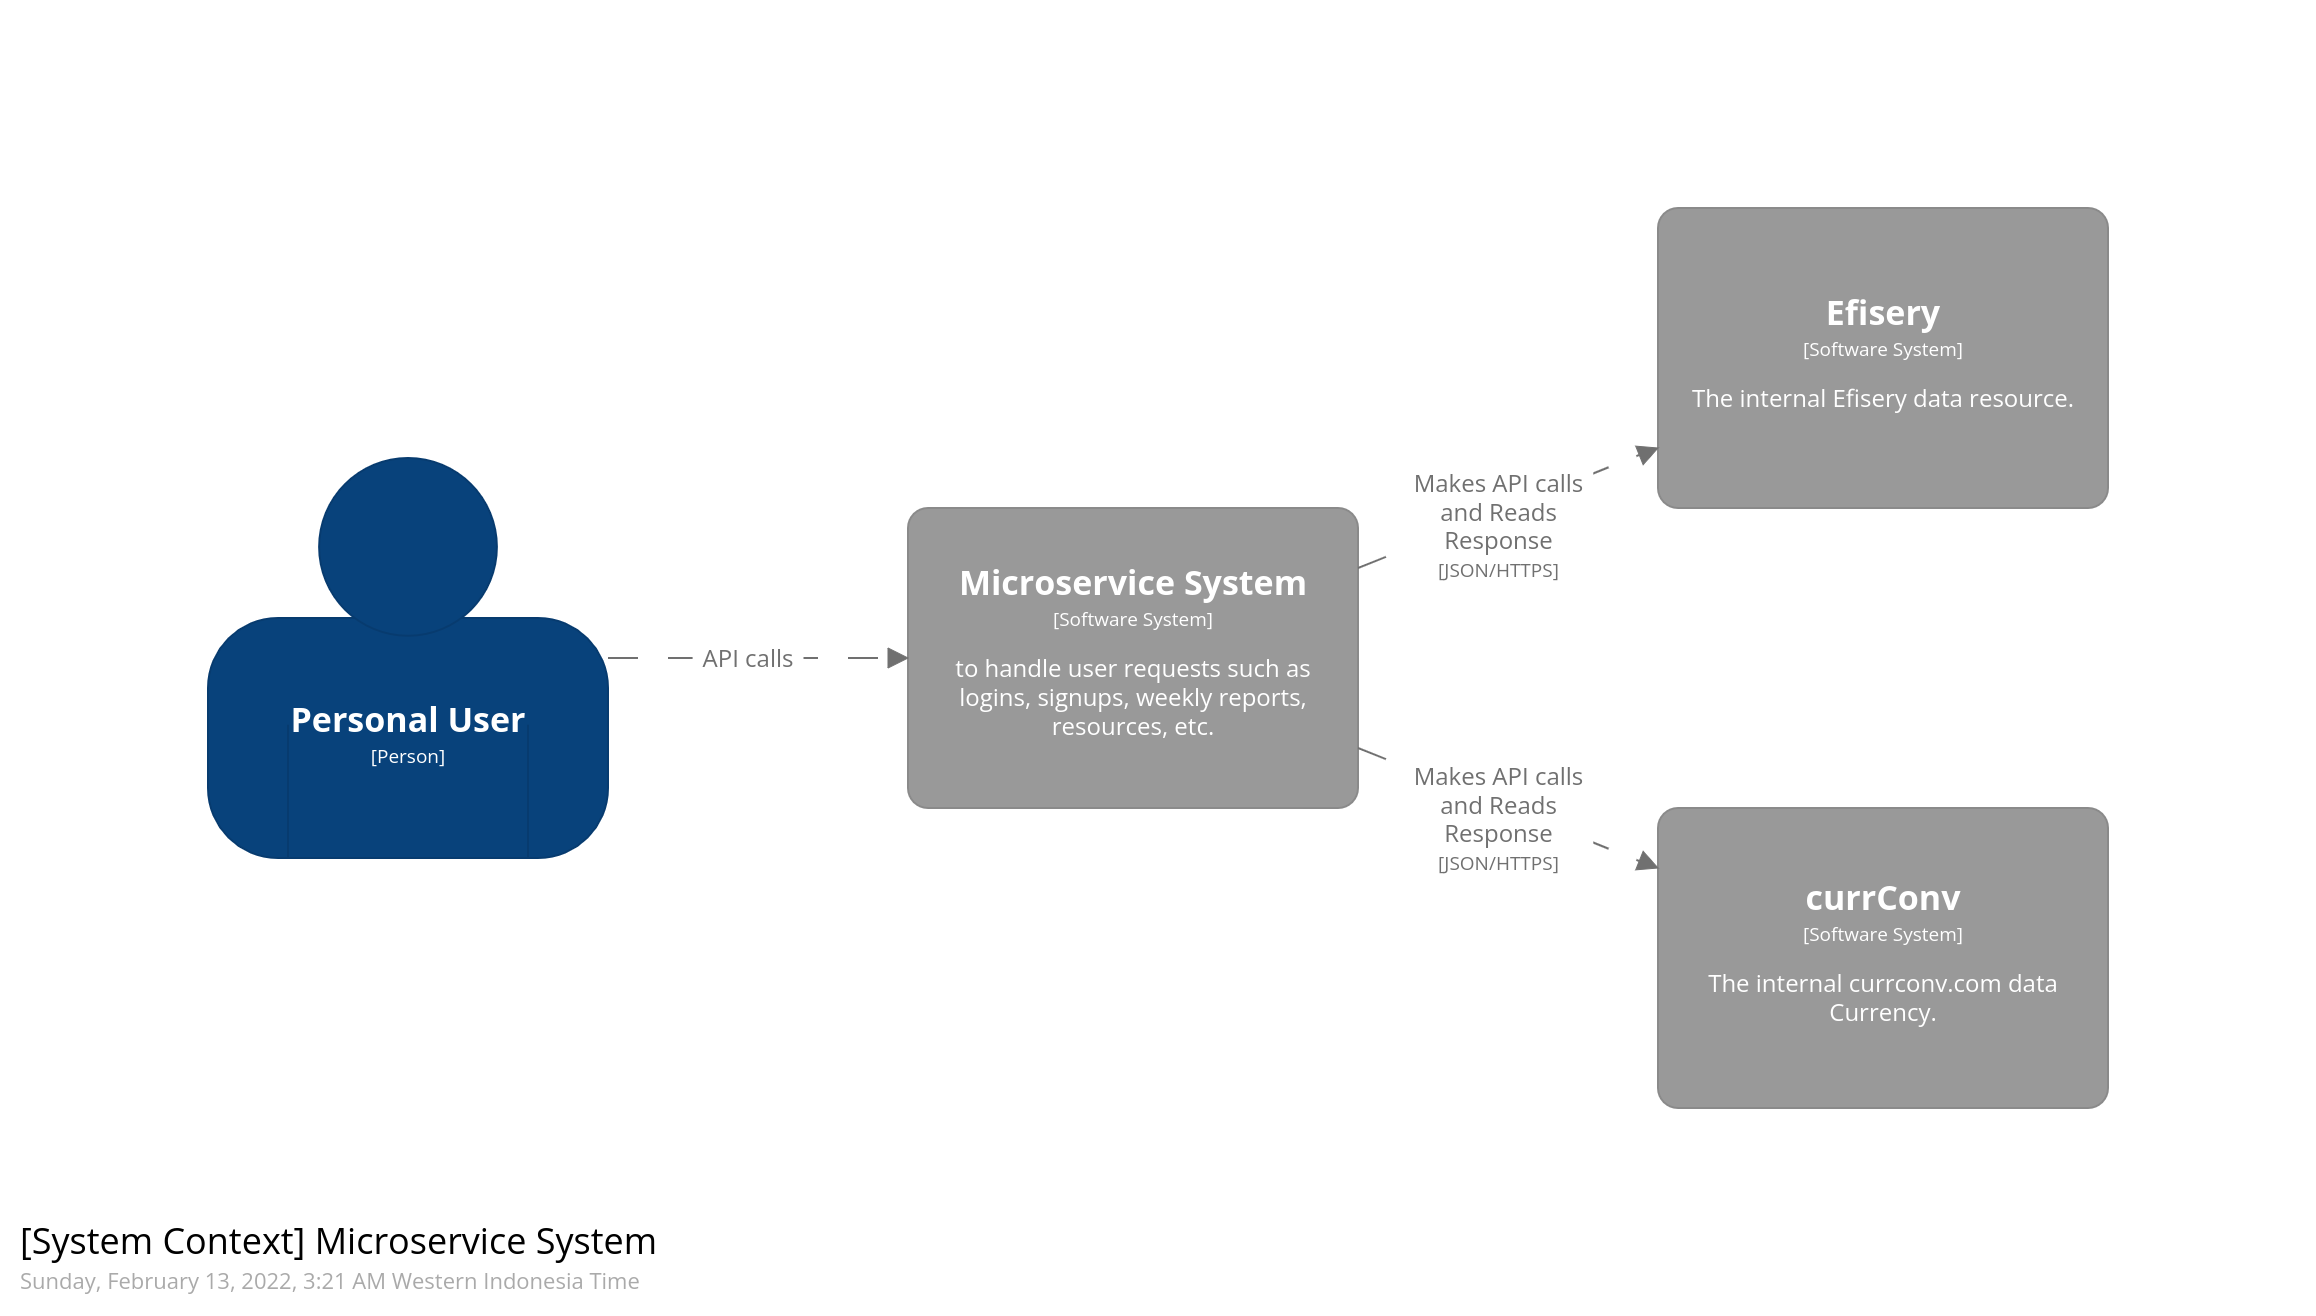
The example application consists of two services: item and order. Both service have a seperate redis instance as their primary data store. When an order gets placed, order contacts item to check if the wished items with the requested quantities are in stock:

Application overview

API endpoints of both services are instrumented via Prometheus and export the following metrics:

  • in_flight_requests: a gauge of requests currently being served by the wrapped handler
  • api_requests_total: a counter for requests to the wrapped handler
  • request_duration_seconds: a histogram for request latencies
  • response_size_bytes: a histogram for response sizes

Additionally, all requests are traced via Jaeger:

Observability overview

On Kubernetes, next to the application and node-specific metrics exposed via node_exporter, internal Kubernetes components are monitored as well:

  • kube-apiserver
  • kube-dns
  • etcd
  • kube-controller-manager
  • kube-scheduler
  • kubelet
  • kube-state-metrics

Proemtheus is fully managed via the Prometheus Operator, allowing flexible deployment of new instances, rules, alertmanagers as well as convenient monitoring of Services via ServiceMonitors. A Mailhog instance is deployed to test the alerting pipeline.

For the ELK Stack, a Filebeat DaemonSet is watching all container logs on the nodes.

Kubernetes overview, arrows are omitted for visibility

Build it

To build it from source you need Go 1.11+ installed.

This project uses Go Modules so you can clone the repo to anywhere:

git clone https://github.com/obitech/micro-obs.git
cd micro-obs/

Run make to test & build it:

make
# ...

Or make docker to build a Docker image:

make docker TAG=yourname/yourimage
# ...

Deploy it

Docker

Make sure Docker and Docker Compose are installed.

Deploy the stack:

cd deploy/docker
docker-compose up -d

Kubernetes

Make sure Docker and Kubernets (via Minikube or microk8s, for example) are installed.

Deploy the monitoring stack first:

kubectl create -f deploy/k8s/000-monitoring --recursive

It might take a while for the Prometheus Operator CRDs to be created. If the deployment fails, try running above command again.

Check if everything is up:

$ kubectl get pods -n monitoring
NAME                                   READY     STATUS    RESTARTS   AGE
alertmanager-main-0                    2/2       Running   0          1m
elasticsearch-f8dc4db44-l7ddn          2/2       Running   0          1m
filebeat-pnx76                         2/2       Running   0          1m
grafana-5bfbfb9665-nf9c9               1/1       Running   0          1m
jaeger-deployment-ff5c4dccc-tfxns      1/1       Running   0          1m
kibana-86c4b5577b-dxtpf                1/1       Running   0          1m
kube-state-metrics-58dcbb8579-hsw78    4/4       Running   0          1m
logstash-74479c885f-5lfcw              1/1       Running   0          1m
mailhog-778bd8484d-8vqfg               1/1       Running   0          1m
node-exporter-swtd6                    2/2       Running   0          1m
prometheus-core-0                      3/3       Running   0          1m
prometheus-operator-85bb8dc95b-wqpx6   1/1       Running   0          1m

Next deploy micro-obs stack:

kubectl create -f deploy/k8s/100-micro-obs/ --recursive

Check if everything is up:

$ kubectl get pods -n micro-obs
NAME                           READY     STATUS    RESTARTS   AGE
item-54d9d7d554-2thtl          1/1       Running   0          1m
order-6549584969-k2cp8         1/1       Running   0          1m
redis-item-5bcf99c9f7-zdf2r    2/2       Running   0          1m
redis-order-68869c7986-4s7w2   2/2       Running   0          1m

Use it

First build the dummy CLI application:

make build-dummy

Docker

Service Location
item API http://localhost:8080/
order API http://localhost:8090/
Jaeger Query http://localhost:16686/
Prometheus http://localhost:9090/
Grafana http://localhost:3000/

Preparation

Create some dummy data:

./bin/dummy data all

Jaeger

After creating dummy data, those transactions can be found in the Jaeger Query UI at http://localhost:16686:

Jaeger UI start screen Jaeger sample trace

Prometheus

Send some dummy requests:

./bin/dummy requests all / /aksdasd /items /orders /delay /error -n 100 -c 5 

Start Grafana and upload the deploy/docker/dashboards/micro-obs.json dashboard:

Grafana micro-obs dashboard example

ELK

After sending some requests, logs can be queried via Kibana running on http://localhost:5601:

Kibana micro-obs error query

Kubernetes

Service Location Internal FQDN
item API http://localhost:30808 http://item.micro-obs.service.cluster.local:8080
item Redis . redis-item.micro-obs.service.cluster.local:3879
order API http://localhost:30809 http://order.micro-obs.service.cluster.local:8090
order Redis . http://redis-order.micro-obs.service.cluster.local:3879
Jaeger Query http://localhost:30686 .
Prometheus http://localhost:30900 http://prometheus.monitoring.svc.cluster.local:9090
Grafana http://localhost:30300 .
ElasticSearch . http://elasticsearch.monitoring.svc.cluster.local:9200
Kibana http://localhost:30601 .
Mailhog http://localhost:32025 mailhog.svc.cluster.local:1025

Preparation

Create some dummy data:

./bin/dummy data all -i http://localhost:30808 -o http://localhost:30809

Jaeger

After creating the dummy data, those transactions can be found in the Jaeger Query UI at http://localhost:30686:

Jaeger UI start screen Jaeger sample trace

Prometheus

Both the Kubernetes' internal components as well as the micro-obs application (TODO) is being monitored by Prometheus. Some pre-installed Dashboards can be found in Grafana via http://localhost:30300 (default login is admin:admin):

Grafana Kubernetes dashboard

ELK

TODO

item

godoc reference for item

Method Endpoint Comment
GET /healthz Returns OK as string
GET /ping Returns a standard API response
GET /items Returns all items
GET /items/{id:[a-zA-Z0-9]+} Returns a single item by ID
DELETE /items/{id:[a-zA-Z0-9]+} Deletes a single item by ID
POST /items Sends a JSON body to create a new item. Will not update if item already exists
PUT /items Sends a JSON body to create or update an item. Will update existing item

Request:

POST http://localhost:8080/items
[
	{
		"name": "banana",
		"desc": "a yello fruit",
		"qty": 5
	},
	{
		"name": "water",
		"desc": "bottles of water",
		"qty": 10
	},
	{
		"name": "apple",
		"desc": "delicious",
		"qty": 15
	}
]

Response:

{
    "status": 201,
    "message": "items BxYs9DiGaIMXuakIxX, GWkUo1hE3u7vTxR, JAQU27CQrTkQCNr,  created",
    "count": 3,
    "data": [
        {
            "name": "banana",
            "id": "BxYs9DiGaIMXuakIxX",
            "desc": "a yello fruit",
            "qty": 5
        },
        {
            "name": "water",
            "id": "GWkUo1hE3u7vTxR",
            "desc": "bottles of water",
            "qty": 10
        },
        {
            "name": "apple",
            "id": "JAQU27CQrTkQCNr",
            "desc": "delicious",
            "qty": 15
        }
    ]
}

order

godoc reference for

Method Endpoint Comment
GET /healthz Returns OK as string
GET /ping Returns a standard API response
GET /orders Returns all orders
GET /orders/{id:[0-9]+} Returns a single order by ID
DELETE /orders/{id:[a-zA-Z0-9]+} Deletes a single order by ID
POST /orders/create Creates a new order. Will query the item service first to check if passed items exist and are present in the wished quantity

Request:

POST http://localhost:8090/orders/create
{
	"items": [
		{
			"id": "BxYs9DiGaIMXuakIxX",
			"qty": 2
		},
		{
			"id": "GWkUo1hE3u7vTxR",
			"qty": 8
		}
	]
}

Response:

{
    "status": 201,
    "message": "order 1 created",
    "count": 1,
    "data": [
        {
            "id": 1,
            "items": [
                {
                    "id": "BxYs9DiGaIMXuakIxX",
                    "qty": 2
                },
                {
                    "id": "GWkUo1hE3u7vTxR",
                    "qty": 8
                }
            ]
        }
    ]
}

util

godoc reference for util

License

MIT

Owner
Alexander Knipping
SRE interested in Distributed Systems, Telemetry and Go.
Alexander Knipping
Similar Resources

Emojivoto - A microservice application that allows users to vote for their favorite emoji

Emojivoto - A microservice application that allows users to vote for their favorite emoji

Emoji.voto A microservice application that allows users to vote for their favori

Feb 16, 2022

Covering basics of Go by writing practical running code. microservice-http server-DAO-Kafka

go1 Covering all basics of Go by writing practical running code. Prerequisite: basic knowledge of c programming language as go is very similar to c in

Mar 30, 2022

Authentication-microservice - Microservice for user authentication built with golang and gRPC

Authentication-microservice - Microservice for user authentication built with golang and gRPC

May 30, 2022

Microservice - A sample architecture of a microservice in go

#microservice Folder structure required. service certs config config.yaml loggin

Feb 3, 2022

Microservice - Microservice golang & nodejs

Microservice - Microservice golang & nodejs

Microservice Gabungan service dari bahasa pemograman go, nodejs Demo API ms-auth

May 21, 2022

Customer-microservice - Microservice of customer built with golang and gRPC

🥳 Building microservices to manage customer data using Go and gRPC Command to g

Sep 8, 2022

Instant Kubernetes-Native Application Observability

Instant Kubernetes-Native Application Observability

What is Pixie? Pixie gives you instant visibility by giving access to metrics, events, traces and logs without changing code. We're building up Pixie

Jan 4, 2023

eBPF based TCP observability.

eBPF based TCP observability.

TCPDog is a total solution from exporting TCP statistics from Linux kernel by eBPF very efficiently to store them at your Elasticsearch or InfluxDB da

Jan 3, 2023

The open and composable observability and data visualization platform. Visualize metrics, logs, and traces from multiple sources like Prometheus, Loki, Elasticsearch, InfluxDB, Postgres and many more.

The open and composable observability and data visualization platform. Visualize metrics, logs, and traces from multiple sources like Prometheus, Loki, Elasticsearch, InfluxDB, Postgres and many more.

The open-source platform for monitoring and observability. Grafana allows you to query, visualize, alert on and understand your metrics no matter wher

Jan 3, 2023

Open source Observability Platform. 👉 SigNoz helps developers find issues in their deployed applications & solve them quickly

Open source Observability Platform. 👉 SigNoz helps developers find issues in their deployed applications & solve them quickly

SigNoz SigNoz is an opensource observability platform. SigNoz uses distributed tracing to gain visibility into your systems and powers data using Kafk

Jan 4, 2023

A distributed, fault-tolerant pipeline for observability data

Table of Contents What Is Veneur? Use Case See Also Status Features Vendor And Backend Agnostic Modern Metrics Format (Or Others!) Global Aggregation

Dec 25, 2022

Hubble - Network, Service & Security Observability for Kubernetes using eBPF

Hubble - Network, Service & Security Observability for Kubernetes using eBPF

Network, Service & Security Observability for Kubernetes What is Hubble? Getting Started Features Service Dependency Graph Metrics & Monitoring Flow V

Jan 2, 2023

TCPProbe is a modern TCP tool and service for network performance observability.

TCPProbe is a modern TCP tool and service for network performance observability.

TCPProbe is a modern TCP tool and service for network performance observability. It exposes information about socket’s underlying TCP session, TLS and HTTP (more than 60 metrics). you can run it through command line or as a service. the request is highly customizable and you can integrate it with your application through gRPC. it runs in a Kubernetes cluster as cloud native application and by adding annotations on pods allow a fine control of the probing process.

Dec 15, 2022

An observability database aims to ingest, analyze and store Metrics, Tracing and Logging data.

An observability database aims to ingest, analyze and store Metrics, Tracing and Logging data.

BanyanDB BanyanDB, as an observability database, aims to ingest, analyze and store Metrics, Tracing and Logging data. It's designed to handle observab

Dec 31, 2022

SigNoz helps developers monitor their applications & troubleshoot problems, an open-source alternative to DataDog, NewRelic, etc. 🔥 🖥. 👉 Open source Application Performance Monitoring (APM) & Observability tool

SigNoz helps developers monitor their applications & troubleshoot problems, an open-source alternative to DataDog, NewRelic, etc. 🔥 🖥.   👉  Open source Application Performance Monitoring (APM) & Observability tool

Monitor your applications and troubleshoot problems in your deployed applications, an open-source alternative to DataDog, New Relic, etc. Documentatio

Sep 24, 2021

Secure Distributed Thanos Deployment using an Observability Cluster

Atlas Status: BETA - I don't expect breaking changes, but still possible. Atlas, forced by Zeus to support the heavens and the skies on his shoulders.

Jun 11, 2022

Recipes for observability solutions at AWS

AWS o11y recipes See aws-observability.github.io/aws-o11y-recipes/. Security See CONTRIBUTING for more information. License This library is licensed u

Nov 30, 2022

ip-masq-agent-v2 aims to solve more specific networking cases, allow for more configuration options, and improve observability compared to the original.

ip-masq-agent-v2 Based on the original ip-masq-agent, v2 aims to solve more specific networking cases, allow for more configuration options, and impro

Aug 31, 2022

Measure the overheads of various observability tools, especially profilers.

strong: WIP - NOT READY TO LOOK AT go-observability-bench Terminology Workload: A Go function performing a small task ( 100ms) like parsing a big blo

Apr 23, 2022
Secure Distributed Thanos Deployment using an Observability Cluster

Atlas Status: BETA - I don't expect breaking changes, but still possible. Atlas, forced by Zeus to support the heavens and the skies on his shoulders.

Jun 11, 2022
ip-masq-agent-v2 aims to solve more specific networking cases, allow for more configuration options, and improve observability compared to the original.

ip-masq-agent-v2 Based on the original ip-masq-agent, v2 aims to solve more specific networking cases, allow for more configuration options, and impro

Aug 31, 2022
Measure the overheads of various observability tools, especially profilers.

strong: WIP - NOT READY TO LOOK AT go-observability-bench Terminology Workload: A Go function performing a small task (< 100ms) like parsing a big blo

Apr 23, 2022
🔥 🔥 Open source cloud native security observability platform. Linux, K8s, AWS Fargate and more. 🔥 🔥
🔥 🔥   Open source cloud native security observability platform. Linux, K8s, AWS Fargate and more. 🔥 🔥

CVE-2021-44228 Log4J Vulnerability can be detected at runtime and attack paths can be visualized by ThreatMapper. Live demo of Log4J Vulnerability her

Jan 1, 2023
Nomad is an easy-to-use, flexible, and performant workload orchestrator that can deploy a mix of microservice, batch, containerized, and non-containerized applications

Nomad is an easy-to-use, flexible, and performant workload orchestrator that can deploy a mix of microservice, batch, containerized, and non-containerized applications. Nomad is easy to operate and scale and has native Consul and Vault integrations.

Jan 5, 2023
⚡️ A dev tool for microservice developers to run local applications and/or forward others from/to Kubernetes SSH or TCP

Your new microservice development environment friend. This CLI tool allows you to define a configuration to work with both local applications (Go, Nod

Jan 4, 2023
Service Discovery and Governance Center for Distributed and Microservice Architecture

Polaris: Service Discovery and Governance English | 简体中文 README: Introduction Components Getting started Chat group Contribution Visit website to lear

Dec 31, 2022
Microservice we use to post reddit posts to a webhook

TypicalBot Reddit Webhook Poster Microservice we use to post reddit posts to a webhook. How to run The SHARED_API environment variable is to hook into

Dec 5, 2021
Service-scaling - Microservice scaling with example

Scaling examples This is the repo for my (Hungarian) Twitch streams where I spea

Jan 8, 2022
Topology-tester - Application to easily test microservice topologies and distributed tracing including K8s and Istio

Topology Tester The Topology Tester app allows you to quickly build a dynamic mi

Jan 14, 2022