A Go metrics interface with fast buffered metrics and third party reporters

✔️ tally GoDoc Build Status Coverage Status

Fast, buffered, hierarchical stats collection in Go.

Installation

go get -u github.com/uber-go/tally

Abstract

Tally provides a common interface for emitting metrics, while letting you not worry about the velocity of metrics emission.

By default it buffers counters, gauges and histograms at a specified interval but does not buffer timer values. This is primarily so timer values can have all their values sampled if desired and if not they can be sampled as summaries or histograms independently by a reporter.

Structure

  • Scope: Keeps track of metrics, and their common metadata.
  • Metrics: Counters, Gauges, Timers and Histograms.
  • Reporter: Implemented by you. Accepts aggregated values from the scope. Forwards the aggregated values to your metrics ingestion pipeline.
    • The reporters already available listed alphabetically are:
      • github.com/uber-go/tally/m3: Report m3 metrics, timers are not sampled and forwarded directly.
      • github.com/uber-go/tally/multi: Report to multiple reporters, you can multi-write metrics to other reporters simply.
      • github.com/uber-go/tally/prometheus: Report prometheus metrics, timers by default are made summaries with an option to make them histograms instead.
      • github.com/uber-go/tally/statsd: Report statsd metrics, no support for tags.

Basics

  • Scopes created with tally provide race-safe registration and use of all metric types Counter, Gauge, Timer, Histogram.
  • NewRootScope(...) returns a Scope and io.Closer, the second return value is used to stop the scope's goroutine reporting values from the scope to it's reporter. This is to reduce the footprint of Scope from the public API for those implementing it themselves to use in Go packages that take a tally Scope.

Acquire a Scope

reporter = NewMyStatsReporter()  // Implement as you will
tags := map[string]string{
	"dc": "east-1",
	"type": "master",
}
reportEvery := time.Second

scope := tally.NewRootScope(tally.ScopeOptions{
	Tags: tags,
	Reporter: reporter,
}, reportEvery)

Get/Create a metric, use it

// Get a counter, increment a counter
reqCounter := scope.Counter("requests")  // cache me
reqCounter.Inc(1)

queueGauge := scope.Gauge("queue_length")  // cache me
queueGauge.Update(42)

Report your metrics

Use the inbuilt statsd reporter:

import (
	"io"
	"github.com/cactus/go-statsd-client/statsd"
	"github.com/uber-go/tally"
	tallystatsd "github.com/uber-go/tally/statsd"
	// ...
)

func newScope() (tally.Scope, io.Closer) {
	statter, _ := statsd.NewBufferedClient("127.0.0.1:8125",
		"stats", 100*time.Millisecond, 1440)

	reporter := tallystatsd.NewReporter(statter, tallystatsd.Options{
		SampleRate: 1.0,
	})

	scope, closer := tally.NewRootScope(tally.ScopeOptions{
		Prefix:   "my-service",
		Tags:     map[string]string{},
		Reporter: reporter,
	}, time.Second)

	return scope, closer
}

Implement your own reporter using the StatsReporter interface:

// BaseStatsReporter implements the shared reporter methods.
type BaseStatsReporter interface {
	Capabilities() Capabilities
	Flush()
}

// StatsReporter is a backend for Scopes to report metrics to.
type StatsReporter interface {
	BaseStatsReporter

	// ReportCounter reports a counter value
	ReportCounter(
		name string,
		tags map[string]string,
		value int64,
	)

	// ReportGauge reports a gauge value
	ReportGauge(
		name string,
		tags map[string]string,
		value float64,
	)

	// ReportTimer reports a timer value
	ReportTimer(
		name string,
		tags map[string]string,
		interval time.Duration,
	)

	// ReportHistogramValueSamples reports histogram samples for a bucket
	ReportHistogramValueSamples(
		name string,
		tags map[string]string,
		buckets Buckets,
		bucketLowerBound,
		bucketUpperBound float64,
		samples int64,
	)

	// ReportHistogramDurationSamples reports histogram samples for a bucket
	ReportHistogramDurationSamples(
		name string,
		tags map[string]string,
		buckets Buckets,
		bucketLowerBound,
		bucketUpperBound time.Duration,
		samples int64,
	)
}

Or implement your own metrics implementation that matches the tally Scope interface to use different buffering semantics:

type Scope interface {
	// Counter returns the Counter object corresponding to the name.
	Counter(name string) Counter

	// Gauge returns the Gauge object corresponding to the name.
	Gauge(name string) Gauge

	// Timer returns the Timer object corresponding to the name.
	Timer(name string) Timer

	// Histogram returns the Histogram object corresponding to the name.
	// To use default value and duration buckets configured for the scope
	// simply pass tally.DefaultBuckets or nil.
	// You can use tally.ValueBuckets{x, y, ...} for value buckets.
	// You can use tally.DurationBuckets{x, y, ...} for duration buckets.
	// You can use tally.MustMakeLinearValueBuckets(start, width, count) for linear values.
	// You can use tally.MustMakeLinearDurationBuckets(start, width, count) for linear durations.
	// You can use tally.MustMakeExponentialValueBuckets(start, factor, count) for exponential values.
	// You can use tally.MustMakeExponentialDurationBuckets(start, factor, count) for exponential durations.
	Histogram(name string, buckets Buckets) Histogram

	// Tagged returns a new child scope with the given tags and current tags.
	Tagged(tags map[string]string) Scope

	// SubScope returns a new child scope appending a further name prefix.
	SubScope(name string) Scope

	// Capabilities returns a description of metrics reporting capabilities.
	Capabilities() Capabilities
}

// Capabilities is a description of metrics reporting capabilities.
type Capabilities interface {
	// Reporting returns whether the reporter has the ability to actively report.
	Reporting() bool

	// Tagging returns whether the reporter has the capability for tagged metrics.
	Tagging() bool
}

Performance

This stuff needs to be fast. With that in mind, we avoid locks and unnecessary memory allocations.

BenchmarkCounterInc-8               	200000000	         7.68 ns/op
BenchmarkReportCounterNoData-8      	300000000	         4.88 ns/op
BenchmarkReportCounterWithData-8    	100000000	        21.6 ns/op
BenchmarkGaugeSet-8                 	100000000	        16.0 ns/op
BenchmarkReportGaugeNoData-8        	100000000	        10.4 ns/op
BenchmarkReportGaugeWithData-8      	50000000	        27.6 ns/op
BenchmarkTimerInterval-8            	50000000	        37.7 ns/op
BenchmarkTimerReport-8              	300000000	         5.69 ns/op

Released under the MIT License.
Owner
Uber Go
Uber's open source software for Go development
Uber Go
Comments
  • Ability to sanitise metric identifiers

    Ability to sanitise metric identifiers

    Added the ability for users to sanitise metrics.

    Benchmark results:

    Master

    ❯ go test -bench=NewMetric ./m3
    BenchmarkNewMetric-4   	10000000	       183 ns/op
    PASS
    ok  	github.com/uber-go/tally/m3	2.364s
    

    PR

    ❯ go test -bench=NewMetric ./m3
    BenchmarkNewMetric-4                   	10000000	       194 ns/op
    BenchmarkNewMetricWithSanitization-4   	 5000000	       413 ns/op
    PASS
    ok  	github.com/uber-go/tally/m3	4.816s
    

    i.e. 6% slowdown for newMetric without sanitisation, and sanitised metrics are 125% slower than non-sanitised metrics.

  • Add native histogram support

    Add native histogram support

    This change adds a native Histogram type to tally. It has the following interface:

    // Histogram is the interface for emitting histogram metrics
    type Histogram interface {
    	// RecordValue records a specific value directly.
    	// Will use the configured value buckets for the histogram.
    	RecordValue(value float64)
    
    	// RecordDuration records a specific duration directly.
    	// Will use the configured duration buckets for the histogram.
    	RecordDuration(value time.Duration)
    
    	// Start gives you a specific point in time to then record a duration.
    	// Will use the configured duration buckets for the histogram.
    	Start() Stopwatch
    }
    

    You can create it from a scope using the signature:

    type Scope interface {
    	// ...
    
    	// Histogram returns the Histogram object corresponding to the name.
    	// To use default value and duration buckets configured for the scope
    	// simply pass tally.DefaultBuckets.
    	// You can use tally.ValueBuckets(x, y, ...) for value buckets.
    	// You can use tally.DurationBuckets(x, y, ...) for duration buckets.
    	// You can use tally.LinearValueBuckets(start, width, count) for linear values.
    	// You can use tally.LinearDurationBuckets(start, width, count) for linear durations.
    	// You can use tally.ExponentialValueBuckets(start, factor, count) for exponential values.
    	// You can use tally.ExponentialDurationBuckets(start, factor, count) for exponential durations.
    	Histogram(name string, buckets Buckets) Histogram
    
    	// ...
    }
    

    Using helpers or inbuilt bucket types you can create a histogram like so:

    // use default value and duration buckets
    h := scope.Histogram("foo", tally.DefaultBuckets) // default buckets, can pass nil too
    h.RecordValue(42.42) // record float value using default value buckets
    h.RecordDuration(42*time.Millisecond) // record duration value using default duration buckets
    
    // use custom duration buckets 
    h := scope.Histogram("foo", DurationBuckets{100*time.Millisecond, 200*time.Millisecond}) 
    h.RecordDuration(150*time.Millisecond)
    
    // use custom value buckets with linear helper
    h := scope.Histogram("foo", LinearValueBuckets(1.5, 1.5, 3)) 
    h.RecordValue(3.3)
    
    // use custom duration buckets with exponential helper
    h := scope.Histogram("foo", ExponentialDurationBuckets(5*time.Millisecond, 1.5, 8)) 
    h.RecordDuration(8*time.Millisecond)
    

    You can specify default buckets on a Scope using DefaultBuckets:

    // ScopeOptions is a set of options to construct a scope.
    type ScopeOptions struct {
    	// ...
    	DefaultBuckets    []Bucket
    	// ...
    }
    

    cc @Raynos @akshayjshah @martin-mao @xichen2020

  • Add M3 reporter backend to tally

    Add M3 reporter backend to tally

    This adds the M3 reporter client to tally as a first class reporter that can be used.

    Whilst open sourcing two breaking changes were added:

    • commonTags[env] is required and not pre-populated.
    • commonTags[host] is required and not pre-populated.

    The logic to compute host & env is not open-sourcable so users of the m3backend will need to pass env and host in themselves.

    Other then that this a straight up port & namespace refactor

    r: @robskillington @martin-mao cc: @Matt-Esch @zhenghuiwang @stevededalus

  • Add CachedReporter interface that supports pre allocation.

    Add CachedReporter interface that supports pre allocation.

    This PR adds a new method NewCachedRootScope and a new CachedReporter interface.

    This CachedReporter interface allows for onetime allocation of counters, gauges & timers. This allows for the CachedReporter to cached the tags map and do pre-computation.

    The actual runtime interface after all the scopes & metrics are allocated at startup just involves ReportCount(int64) and friends.

    This enables a reporter backend to implement a more involved BUT more performant interface.

    I've got a benchmark using an internal reporter where I was measuring the overhead of adding 3 timers to a HTTP server.

    • master, 3 tally.Timers per request ~= 27% cpu overhead & 50 allocs per timer
    • this branch, 3 tally.Timers per request ~= 11% cpu overhead & 25 allocs per timer

    This is a 2x improvement and allows us to have more timers in our applications.

    r: @robskillington @martin-mao cc: @Matt-Esch @zhenghuiwang

  • Removing m3db forked packages

    Removing m3db forked packages

    Tally is using bunch of m3db forked packages. These forks don't provide any use and they prevent from using the rest of the Prometheus library in conjunction with tally. For ex I should be able to do this:

     reg := prometheus.NewRegistry()
    grpcMetrics := grpc_prometheus.NewServerMetrics()
    reg.MustRegister(grpcMetrics)
    var registerer prometheus.Registerer = reg
    r := promreporter.NewReporter(promreporter.Options{
      Registerer: reg,
    })
    
  • Implement InstrumentedCall

    Implement InstrumentedCall

    go-common's metric interface includes this functionality. It would be great to include it in tally as well since it simplifies application code, we don't need to explicitly handle timers and error cases every time we want to include metrics

  • Use a unique ID for metrics returned from Snapshot

    Use a unique ID for metrics returned from Snapshot

    This PR addresses #34 by introducing a new function uniqueID which will create a unique ID for a metric using it fully qualified name and tags. This ID is then used as the key for the maps created Snapshot so that metrics with the same fully qualified names but different tags will not overwrite one another.

  • Fix statsd dependency

    Fix statsd dependency

    From v3.1.1 to v3.2.1, https://github.com/cactus/go-statsd-client half-way moved to go mod and made the statsd/ subdirectory a module in itself (granted they should have been using /v3 path, but that came with later versions).

    So this means across minor versions there is a mismatch between the https://github.com/cactus/go-statsd-client module and the https://github.com/cactus/go-statsd-client/statsd module. If you had the https://github.com/cactus/go-statsd-client/statsd module at v3.2.1 (i.e. https://github.com/cactus/go-statsd-client/commit/cb0885a1018c) and the latest tally library in your go mod and did a go mod tidy, on go 1.16 you break and on go 1.17 you get:

    github.com/cretz/tally-sample imports
            github.com/cactus/go-statsd-client/statsd loaded from github.com/cactus/go-statsd-client/[email protected],
            but go 1.16 would fail to locate it:
            ambiguous import: found package github.com/cactus/go-statsd-client/statsd in multiple modules:
            github.com/cactus/go-statsd-client v3.1.1+incompatible (C:\Users\user\go\pkg\mod\github.com\cactus\[email protected]+incompatible\statsd)
            github.com/cactus/go-statsd-client/statsd v0.0.0-20200423205355-cb0885a1018c (C:\Users\user\go\pkg\mod\github.com\cactus\go-statsd-client\[email protected])
    
    To proceed despite packages unresolved in go 1.16:
            go mod tidy -e
    If reproducibility with go 1.16 is not needed:
            go mod tidy -compat=1.17
    For other options, see:
            https://golang.org/doc/modules/pruning
    

    This PR upgrades statsd to the latest tag before they started using /v4 and /v5 imports in order to solve this. There are other potential solutions such as upgrading statsd client all the way to /v5 or making the statsd/ folder in here its own module (i.e. having its own go.mod) and not infecting others with this old statsd dependency.

    Can this be merged (or solved another way) and be tagged w/ a minor version? Thanks!

  • Use semver dependency on Apache Thrift

    Use semver dependency on Apache Thrift

    Apache Thrift made a breaking api change in the 0.11 series. This package relies on the ~0.10 API. Currently downstream packages using dep do not inherit this package's transitive dependency constraint on apache thrift because dep does not consider revision pins when importing constraints from alternate dependency managers. By using a semver range instead of a direct pin.

    Another parallel path is to propose amending Dep to consider Glide revision pins as valid transitive constraints. We can do that unilaterally in our fork of dep but it would be much better if we worked with upstream. This pull request gets us out of the immediate pain and unblocks migration to dep within Uber.

  • Emit latency metric on both success and error for instrumented call

    Emit latency metric on both success and error for instrumented call

    The subtlety of the instrumented call only emitting metrics on success can hide latency that occurs when an error is encountered. This change will emit latency in the case of errors as well to revert this subtle behavior.

    Users of tally will have to emit their own success metrics if they want to track that latency separately.

    cc @kamran-m

  • add ExecWithFilter

    add ExecWithFilter

    Sometimes, an instrumented call can return an error that we don't actually want to count as an error, but rather as a success. A classic use case for this is returning an error like "BadRequest" to a caller. In this case, the server hasn't actually caused an error. It's running as expected and we'd like to count this as a success. Never the less, we still need to propagate the error to the caller.

    Let's add ExecWithFilter, it's the same as Exec, except we allow the user to define a function that let's use know whether or not to log the result as an error or if the call was actually a success despite the error.

  • update go-statsd-client to v5

    update go-statsd-client to v5

    Motivation

    Current go-statsd-client is too old. Dependency commit is 2years ago.

    https://github.com/cactus/go-statsd-client/tree/cb0885a1018c53bc05535cfbbd1fb858430b9f8c

    Discussion

    It has a breaking change on func NewReporter(statsd statsd.Statter, opts Options) tally.StatsReporter.

    Upgrade guide is just change like a following.

    -	"github.com/cactus/go-statsd-client/statsd"
    +	"github.com/cactus/go-statsd-client/v5/statsd"
    
  • Possibility to use different tags format for statsd

    Possibility to use different tags format for statsd

    With the new version of cactus/go-statsd-client there is a possibility to use different tags format - https://github.com/cactus/go-statsd-client/blob/master/statsd/client_test.go#L97

  • Vendored Thrift v0.10.0 has security vulnerabilities

    Vendored Thrift v0.10.0 has security vulnerabilities

    We are using tally and our security scanner open this issue: https://github.com/temporalio/temporal/issues/3370.

    I understand that it was vendored in #104 for a reason, but I believe it is time to upgrade it.

  • Unnecessary contention in stats implementation

    Unnecessary contention in stats implementation

    In file stats.go, all code paths accessing (*counter).prev are protected with a mutex, yet every time the field is being accessed with an atomic Load/Store operation. These are the possible code paths accessing the field, in reverse order:

    • (*counter).prev > (*counter).value [ReadWrite] >
      • (*counter).report > (*scope).report, protected by (*scope).cm.RLock
      • (*counter).cachedReport > (*scope).cachedReport, protected by (*scope).cm.RLock
      • (*histogram).report > (*scope).report, protected by (*scope).hm.RLock
      • (*histogram).cachedReport > (*scope).cachedReport, protected by (*scope).hm.RLock
    • (*counter).prev > (*counter).snapshot [Read] >
      • (*scope).Snapshot, protected by (*scope).cm.RLock
      • (*histogram).snapshotValues > (*scope).Snapshot, protected by (*scope).hm.RLock
      • (*histogram).snapshotDurations > (*scope).Snapshot, protected by (*scope).hm.RLock

    Note that:

    • A (*histogram) can have multiple (*counter) but only its methods access them, i.e. clients of (*histogram) only use its methods, not its fields.
    • There's no background forking in any of the methods, so e.g. (*scope).Snapshot would work sequentially inside the (R)Lock/(R)Unlock blocks of each mutex.

    So (*counter).prev is always protected by a mutex, there's no need for atomic operations to access it.

  • Support weight in histogram emitting

    Support weight in histogram emitting

    I need to emit latency metrics through m3. Is there a way to emit timer metrics or histogram metrics with weight?

    Basically, we are emitting how long a single request takes. Sometimes, the request is batching. for example, a batch request with a size of 10, we will calculate how much a single request takes, and emit that 10 times. Wondering whether the api can directly let me set a weight for that timer or histogram, so it knows this is 10 data pointers rather than 1

    right now, we can do something like

    hist := scope.Histogram(...)
    
    for i := 0; i < 10; i++ {
      hist.Record(val)
    }


    wondering, whether the API can support something like

    hist := scope.Histogram(...)
    hist.Record(val, weight = 10)
    
    
Related tags
Uniform interface for interacting with network hardware via telnet/ssh

jgivc/console This package provides a uniform interface for interacting with network hardware via telnet/ssh This package uses part of reiver/go-telne

Dec 9, 2021
Golang interface for local/remote DRM CDM services (NO DRM IMPLEMENTATION HERE)

NO DRM IMPLEMENTATION HERE! ONLY ABSTRAT INTERFACE! What It's a generalized interface for different types of CDM for WEBDL use. A remote CDM JSON-RPC

Oct 24, 2022
Go implementation of SipHash-2-4, a fast short-input PRF created by Jean-Philippe Aumasson and Daniel J. Bernstein.

SipHash (Go) Go implementation of SipHash-2-4, a fast short-input PRF created by Jean-Philippe Aumasson and Daniel J. Bernstein (http://131002.net/sip

Dec 25, 2022
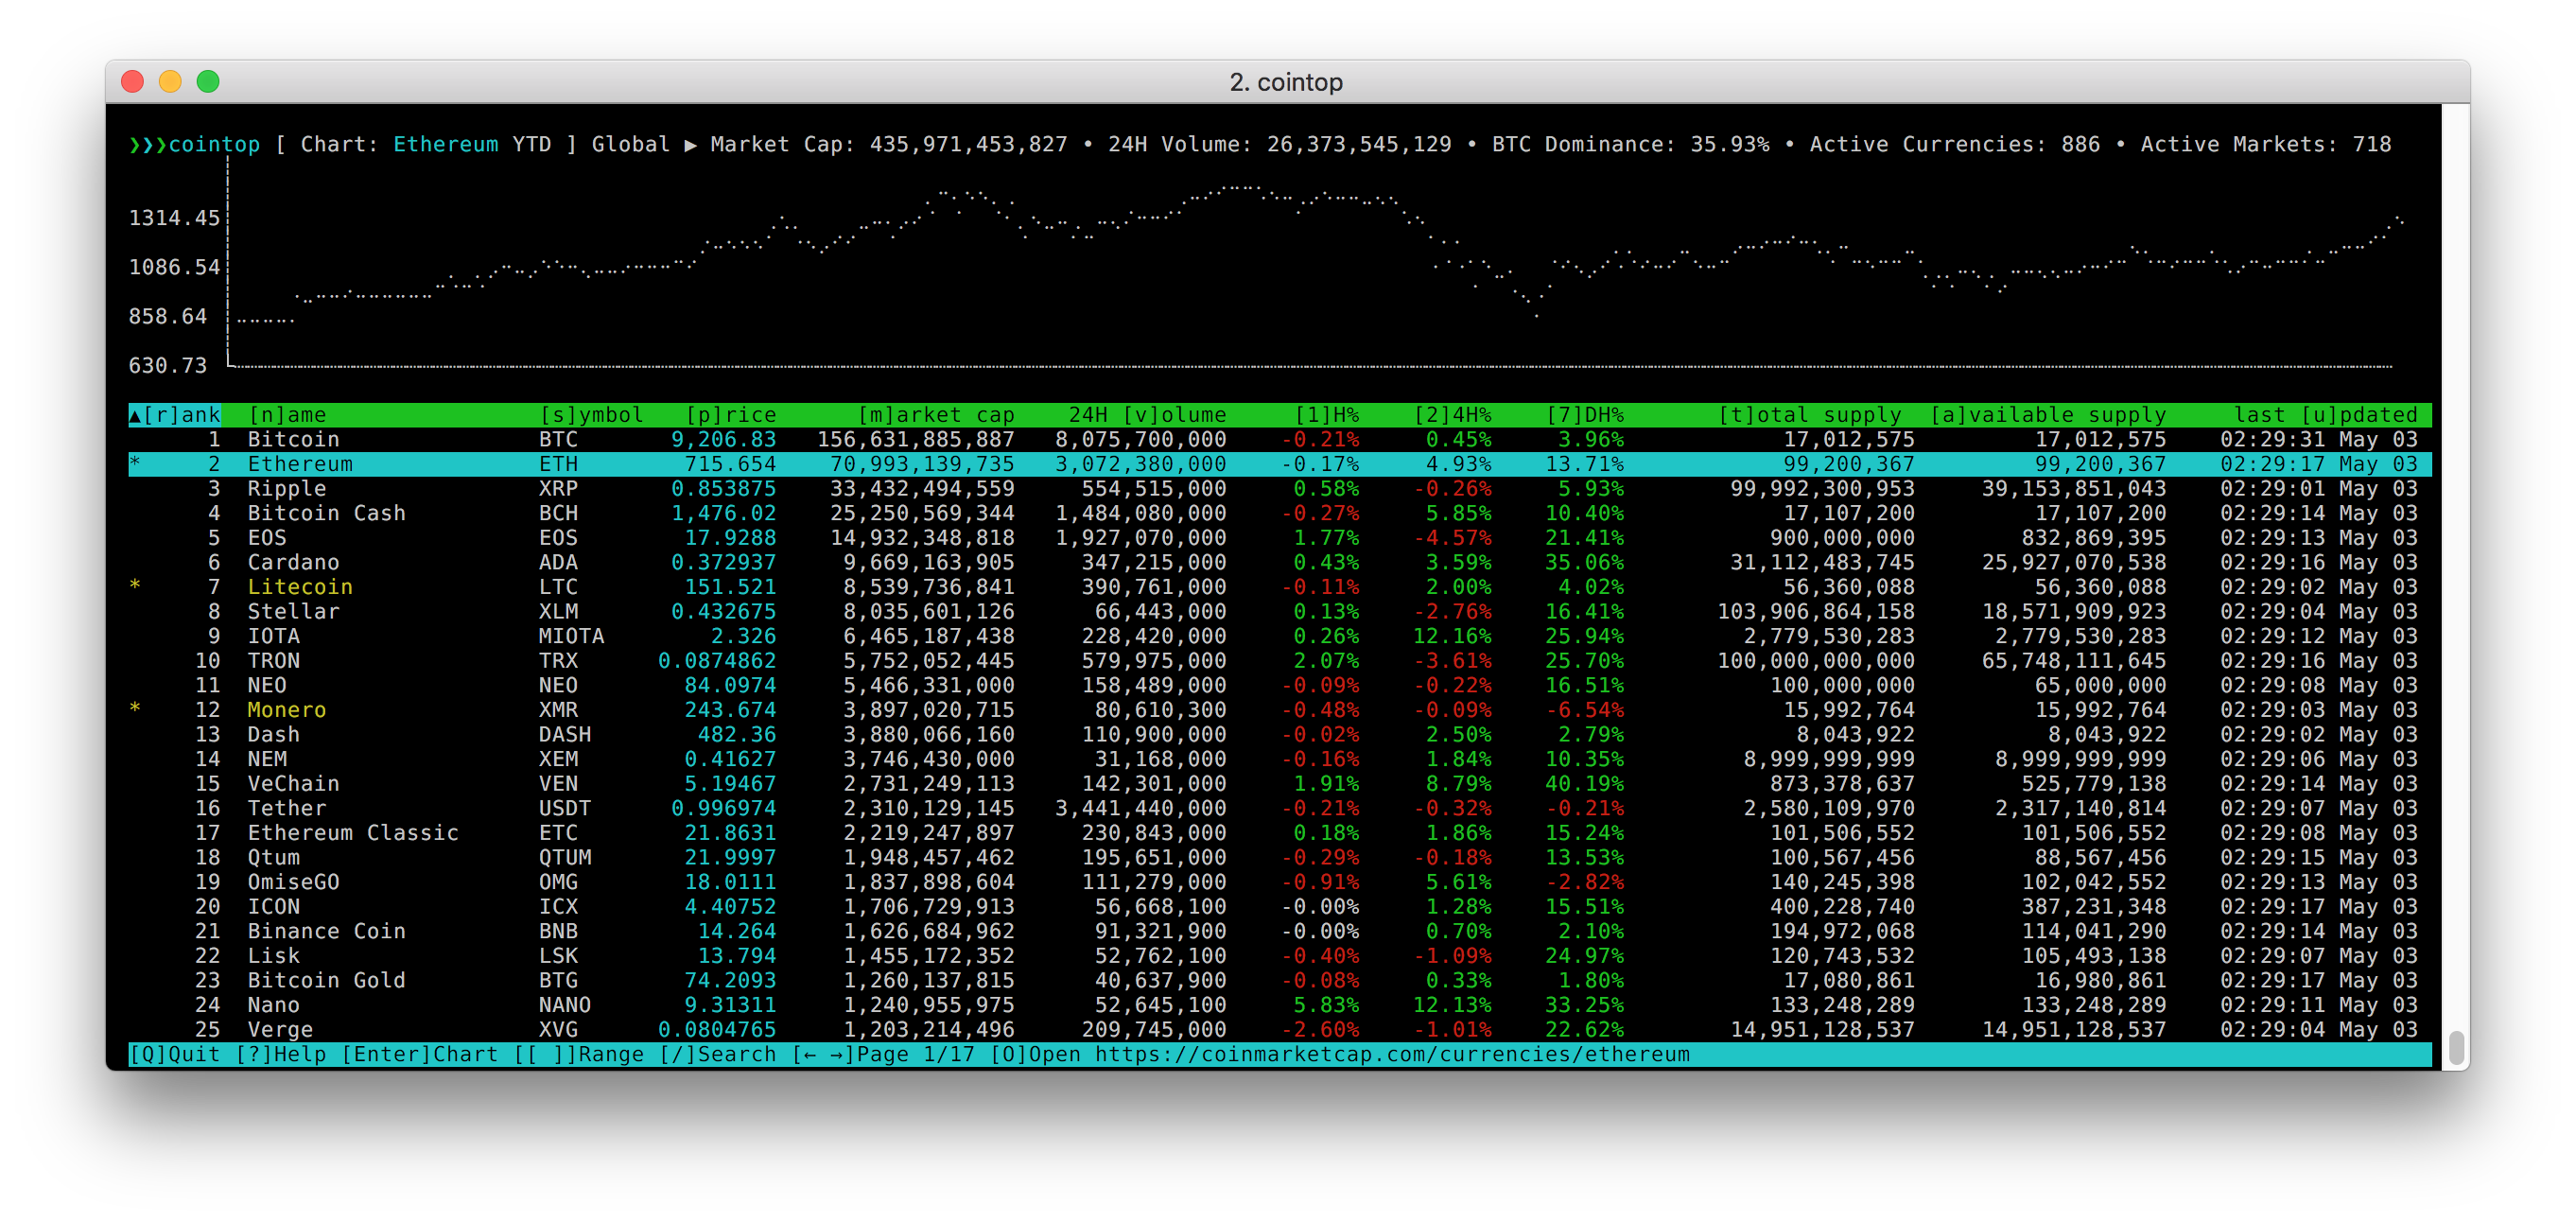
A fast and lightweight interactive terminal based UI application for tracking cryptocurrencies 🚀

cointop is a fast and lightweight interactive terminal based UI application for tracking and monitoring cryptocurrency coin stats in real-time.

Jan 6, 2023
Arbitrum is a Layer 2 cryptocurrency platform that makes smart contracts scalable, fast, and private.

Arbitrum is a Layer 2 cryptocurrency platform that makes smart contracts scalable, fast, and private. Arbitrum interoperates closely with Ethereum, so Ethereum developers can easily cross-compile their contracts to run on Arbitrum. Arbitrum achieves these goals through a unique combination of incentives, network protocol design, and virtual machine architecture.

Jan 8, 2023
CircleHash is a family of fast hashes that pass SMHasher, are faster than XXH64, SipHash, etc. and are easy to audit

CircleHash CircleHash is a family of non-cryptographic hash functions that pass every test in SMHasher (both rurban/smhasher and demerphq/smhasher). T

Sep 18, 2022
A blockchains platform with high throughput, and blazing fast transactions

Node implementation for the Avalanche network - a blockchains platform with high throughput, and blazing fast transactions. Installation Avalanche is

Oct 31, 2021
Ethermint is a scalable and interoperable Ethereum library, built on Proof-of-Stake with fast-finality using the Cosmos SDK.

Ethermint Ethermint is a scalable and interoperable Ethereum library, built on Proof-of-Stake with fast-finality using the Cosmos SDK which runs on to

Jan 3, 2023
Simple, fast and safe cross-platform linear binary stream communication protocol. AES key exchange based on ecc secp256k1

FFAX Protocol 2 dev 简体中文 Welcome to FFAX Protocol v2 Quick start go get github.com/RealFax/FFAX func example() { listener, err := net.Listen("tcp",

Mar 21, 2022
Dijetsnetgo: a blockchains platform with high throughput, and blazing fast transactions

Node implementation for the Avalanche network - a blockchains platform with high

Jan 18, 2022
Streaming Fast on Ethereum

Stream Ethereum data like there's no tomorrow

Dec 15, 2022
Hashkill - A fast hash decryptor with golang

Hashkill ♻️ Changelog v0.2 Added timing Fixed running, the program breaks if all

Mar 24, 2022
sops is an editor of encrypted files that supports YAML, JSON, ENV, INI and BINARY formats and encrypts with AWS KMS, GCP KMS, Azure Key Vault, age, and PGP

sops is an editor of encrypted files that supports YAML, JSON, ENV, INI and BINARY formats and encrypts with AWS KMS, GCP KMS, Azure Key Vault, age, and PGP. (demo)

Jan 9, 2023
A simple, modern and secure encryption tool (and Go library) with small explicit keys, no config options, and UNIX-style composability.

A simple, modern and secure encryption tool (and Go library) with small explicit keys, no config options, and UNIX-style composability.

Jan 7, 2023
Jan 7, 2023
Webserver I built to serve Infura endpoints. Deployable via k8s and AWS EKS. Load testable via k6 tooling, and montiorable via prometheus and grafana

Infura Web Server Welcome to my verion of the take home project. I've created a webserver written in go to serve Infura api data over 3 possible data

Nov 15, 2022
Get any cryptocurrencies ticker and trade data in real time from multiple exchanges and then save it in multiple storage systems.

Cryptogalaxy is an app which will get any cryptocurrencies ticker and trade data in real time from multiple exchanges and then saves it in multiple storage systems.

Jan 4, 2023
OmniFlix Hub is a blockchain built using Cosmos SDK and Tendermint and created with Starport.

OmniFlix Hub is the root chain of the OmniFlix Network. Sovereign chains and DAOs connect to the OmniFlix Hub to manage their web2 & web3 media operations (mint, manage, distribute & monetize) as well as community interactions.

Nov 10, 2022