go-charts
![]()
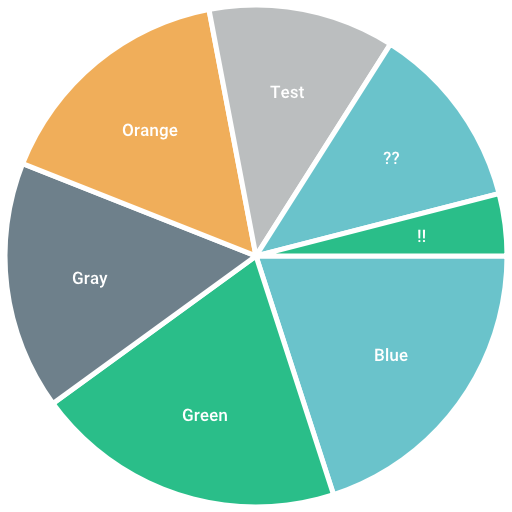
go-charts基于go-chart生成数据图表,无其它模块的依赖纯golang的实现,支持svg与png的输出,Apache ECharts在前端开发中得到众多开发者的认可,go-charts兼容Apache ECharts的配置参数,简单快捷的生成相似的图表(svg或png),方便插入至Email或分享使用。下面为常用的几种图表截图(黑夜模式):

支持图表类型
暂仅支持三种的图表类型:line, bar 以及 pie
示例
go-charts兼容了echarts的参数配置,可简单的使用json形式的配置字符串则可快速生成图表。
package main

import (
	"os"

	charts "github.com/vicanso/go-charts"
)

func main() {
	buf, err := charts.RenderEChartsToPNG(`{
		"title": {
			"text": "Line"
		},
		"xAxis": {
			"type": "category",
			"data": ["Mon", "Tue", "Wed", "Thu", "Fri", "Sat", "Sun"]
		},
		"series": [
			{
				"data": [150, 230, 224, 218, 135, 147, 260]
			}
		]
	}`)
	if err != nil {
		panic(err)
	}
	os.WriteFile("output.png", buf, 0600)
}
参数说明
theme颜色主题,支持dark与light模式,默认为lightpadding图表的内边距,单位px。支持以下几种模式的设置padding: 5设置内边距为5padding: [5, 10]设置上下的内边距为 5,左右的内边距为 10padding:[5, 10, 5, 10]分别设置上右下左边距
title图表标题,包括标题内容、高度、颜色等title.text标题内容title.textStyle.color标题文字颜色title.textStyle.fontSize标题文字字体大小title.textStyle.height标题高度
xAxis直角坐标系grid中的x轴,由于go-charts仅支持单一个x轴,因此若参数为数组多个x轴,只使用第一个配置xAxis.boundaryGap坐标轴两边留白策略,仅支持三种设置方式null,true或者false。null或true时则数据点展示在两个刻度中间xAxis.splitNumber坐标轴的分割段数,需要注意的是这个分割段数只是个预估值,最后实际显示的段数会在这个基础上根据分割后坐标轴刻度显示的易读程度作调整xAxis.datax轴的展示文案,暂只支持字符串数组,如["Mon", "Tue"],其数量需要与展示点一致
yAxis直角坐标系grid中的y轴,最多支持两个y轴yAxis.min坐标轴刻度最小值,若不设置则自动计算yAxis.max坐标轴刻度最大值,若不设置则自动计算yAxis.axisLabel.formatter刻度标签的内容格式器,如"formatter": "{value} kg"
legend图表中不同系列的标记legend.data图例的数据数组,为字符串数组,如["Email", "Video Ads"]legend.align图例标记和文本的对齐,默认为标记靠左leftlegend.paddinglegend的padding,配置方式与图表的padding一致legend.leftlegend离容器左侧的距离,其值可以为具体的像素值(20)或百分比(20%)legend.rightlegend离容器右侧的距离,其值可以为具体的像素值(20)或百分比(20%)
series图表的数据项列表series.type图表的展示类型,暂支持line,bar以及pie,需要注意pie只能单独使用series.yAxisIndex该数据项使用的y轴,默认为0,对yAxis的配置对应series.itemStyle.color该数据项展示时使用的颜色series.data数据项对应的数据数组,支持以下形式的数据:数值常用形式,数组数据为浮点数组,如[1.1, 2,3, 5.2]结构体pie图表或bar图表中指定样式使用,如[{"value": 1048, "name": "Search Engine"},{"value": 735,"name": "Direct"}]
性能
简单的图表生成PNG在20ms左右,而SVG的性能则更快,性能上比起使用chrome headless加载echarts图表展示页面,截图生成的方式大幅度提升,基本能满足简单的图表生成需求。
goos: darwin
goarch: amd64
pkg: github.com/vicanso/go-charts
cpu: Intel(R) Core(TM) i5-8257U CPU @ 1.40GHz
BenchmarkEChartsRenderPNG-8           60          17765045 ns/op         2492854 B/op       1007 allocs/op
BenchmarkEChartsRenderSVG-8          282           4303042 ns/op        32622688 B/op       2983 allocs/op


 代码:
代码: