180 Resources
Golang prometheus Libraries
An example logging system using Prometheus, Loki, and Grafana.

Logging Example Structure Collector Export numerical data for Prometheus and log data for Promtail. Exporter uses port 8080 Log files are saved to ./c
A blockcypher exporter to monitor your blockchain nodes to Prometheus.
A blockcypher exporter to monitor your blockchain nodes to Prometheus. Metrics are retrieved using the BlockCypher REST API.
A tool based on eBPF, prometheus and grafana to monitor network connectivity.

Connectivity Monitor Tracks the connectivity of a kubernetes cluster to its api server and exposes meaningful connectivity metrics. Uses ebpf to obser
Opinionated boilerplate Golang HTTP server with CORS, OPA, Prometheus, rate-limiter for API and static website.
Teal.Finance/Server Opinionated boilerplate HTTP server with CORS, OPA, Prometheus, rate-limiter… for API and static website. Origin This library was
Prometheus exporter for APC UPSes controlled by apcupsd
Prometheus exporter for APC UPSes controlled by apcupsd
Secure Distributed Thanos Deployment using an Observability Cluster
Atlas Status: BETA - I don't expect breaking changes, but still possible. Atlas, forced by Zeus to support the heavens and the skies on his shoulders.
A prometheus exporter for monitoring FIO nodeos nodes.

fio-prometheus-exporter This is a simple prometheus exporter for FIO nodeos nodes. It can connect to multiple nodes to display a few critical statisti
🚨 Collection of Prometheus alerting rules
👋 Awesome Prometheus Alerts Most alerting rules are common to every Prometheus setup. We need a place to find them all. 🤘 🚨 📊 Collection available
Continuous profiling for analysis of CPU, memory usage over time, and down to the line number. Saving infrastructure cost, improving performance, and increasing reliability.

Continuous profiling for analysis of CPU, memory usage over time, and down to the line number. Saving infrastructure cost, improving performance, and increasing reliability.
Cli tool to relabel Prometheus TSDB block via Thanos rewrite
promrelabel Tool for easier relabeling prometheus TSDB block data. This cli tool does the same thing as thanos tools bucket rewrite --rewrite.to-relab
Prometheus exporter for DeadMansSnitch
DeadMansSnitch Exporter Prometheus exporter for DeadMansSnitch information (snitches) Configuration Usage: deadmanssnitch-exporter [OPTIONS] Applic
Prometheus exporter for Indian National Stock Exchange (NSE).
Open Stocks Exporter Prometheus exporter for stocks. Open-Stocks-Exporter uses Yahoo finance API under the hood, to fetch stock entities in real-time
A simple tool who pulls data from Online.net API and parse them to a Prometheus format
Dedibox backup monitoring A simple tool who reads API from Online.net and parse them into a Prometheus-compatible format. Conceived to be lightweight,
Prometheus Common Data Exporter can parse JSON, XML, yaml or other format data from various sources (such as HTTP response message, local file, TCP response message and UDP response message) into Prometheus metric data.

Prometheus Common Data Exporter Prometheus Common Data Exporter 用于将多种来源(如http响应报文、本地文件、TCP响应报文、UDP响应报文)的Json、xml、yaml或其它格式的数据,解析为Prometheus metric数据。
Prometheus exporter for Amazon Elastic Container Service (ECS)
ecs_exporter 🚧 🚧 🚧 This repo is still work in progress and is subject to change. This repo contains a Prometheus exporter for Amazon Elastic Contai
SigNoz helps developers monitor their applications & troubleshoot problems, an open-source alternative to DataDog, NewRelic, etc. 🔥 🖥. 👉 Open source Application Performance Monitoring (APM) & Observability tool
Monitor your applications and troubleshoot problems in your deployed applications, an open-source alternative to DataDog, New Relic, etc. Documentatio
mtail - extract internal monitoring data from application logs for collection into a timeseries database
mtail - extract internal monitoring data from application logs for collection into a timeseries database mtail is a tool for extracting metrics from a
PromQL Prettier
PromQL Prettier Have trouble in reading PromQL written by your colleagues or SRE team? promql-prettier to the rescue! Thanks for WebAssembly, you can
Alert dashboard for Prometheus Alertmanager

karma Alert dashboard for Prometheus Alertmanager. Alertmanager =0.19.0 is required as older versions might not show all receivers in karma, see issu
SFTPGo - Fully featured and highly configurable SFTP server with optional FTP/S and WebDAV support - S3, Google Cloud Storage, Azure Blob
SFTPGo - Fully featured and highly configurable SFTP server with optional FTP/S and WebDAV support - S3, Google Cloud Storage, Azure Blob
Go gRPC Kafka CQRS microservices with tracing
Golang CQRS Kafka gRPC Postgresql MongoDB Redis microservices example 👋 👨💻 Full list what has been used: Kafka as messages broker gRPC Go implemen
A proxy that authorizes and enforces a given label in a given PromQL query
prom-authzed-proxy prom-authzed-proxy is a proxy for Prometheus that authorizes the request's Bearer Token with Authzed and enforces a label in a Prom
Discover expired TLS certificates in the services of a kubernetes cluster
About verify-k8s-certs is a daemon (prometheus exporter) to discover expired TLS certificates in a kubernetes cluster. It exposes the informations as
NVIDIA GPU metrics exporter for Prometheus leveraging DCGM
DCGM-Exporter This repository contains the DCGM-Exporter project. It exposes GPU metrics exporter for Prometheus leveraging NVIDIA DCGM. Documentation
an unofficial prometheus exporter for the Hochwassernachrichtendienst Bayern.
Hochwassernachrichtendienst Exporter an unofficial prometheus exporter for the Hochwassernachrichtendienst Bayern. Usage Usage of ./hochwassernachrich
Prometheus exporter for counting connected devices to a network using nmap
nmapprom Prometheus exporter for counting the hosts connected to a network using nmap · Report Bug · Request Feature Table of Contents About The Proje
a simple wrapper around resty to report HTTP calls metrics to prometheus
restyprom a simple wrapper around resty to report HTTP calls metrics to prometheus If you're using resty and want to have metrics of your HTTP calls,
Exports Fast.com metrics in the prometheus format, caching the results.
fastcom-exporter Exports Fast.com metrics in the prometheus format, caching the results.
🤔 A minimize Time Series Database, written from scratch as a learning project.

mandodb 🤔 A minimize Time Series Database, written from scratch as a learning project. 时序数据库(TSDB: Time Series Database)大多数时候都是为了满足监控场景的需求,这里先介绍两个概念:
ThanosDecryptor is an project to decrypt files encrypted by Thanos ransomware.
Prometheus-Decryptor Prometheus-Decryptor is an project to decrypt files encrypted by Prometheus ransomware. Command Arguments Usage of ./bin/promethe
Prometheus metrics for Go database/sql via VictoriaMetrics/metrics
sqlmetrics Prometheus metrics for Go database/sql via VictoriaMetrics/metrics Features Simple API. Easy to integrate. Install Go version 1.16+ go get
Generic Prometheus ⟷ MQTT Bridge
Promqtt: Prometheus ⟷ MQTT Bridge Promqtt makes Prometheus MQTT capable in a truly generic way. It has no assumptions on message payloads or topic lay
Nvidia GPU exporter for prometheus using nvidia-smi binary
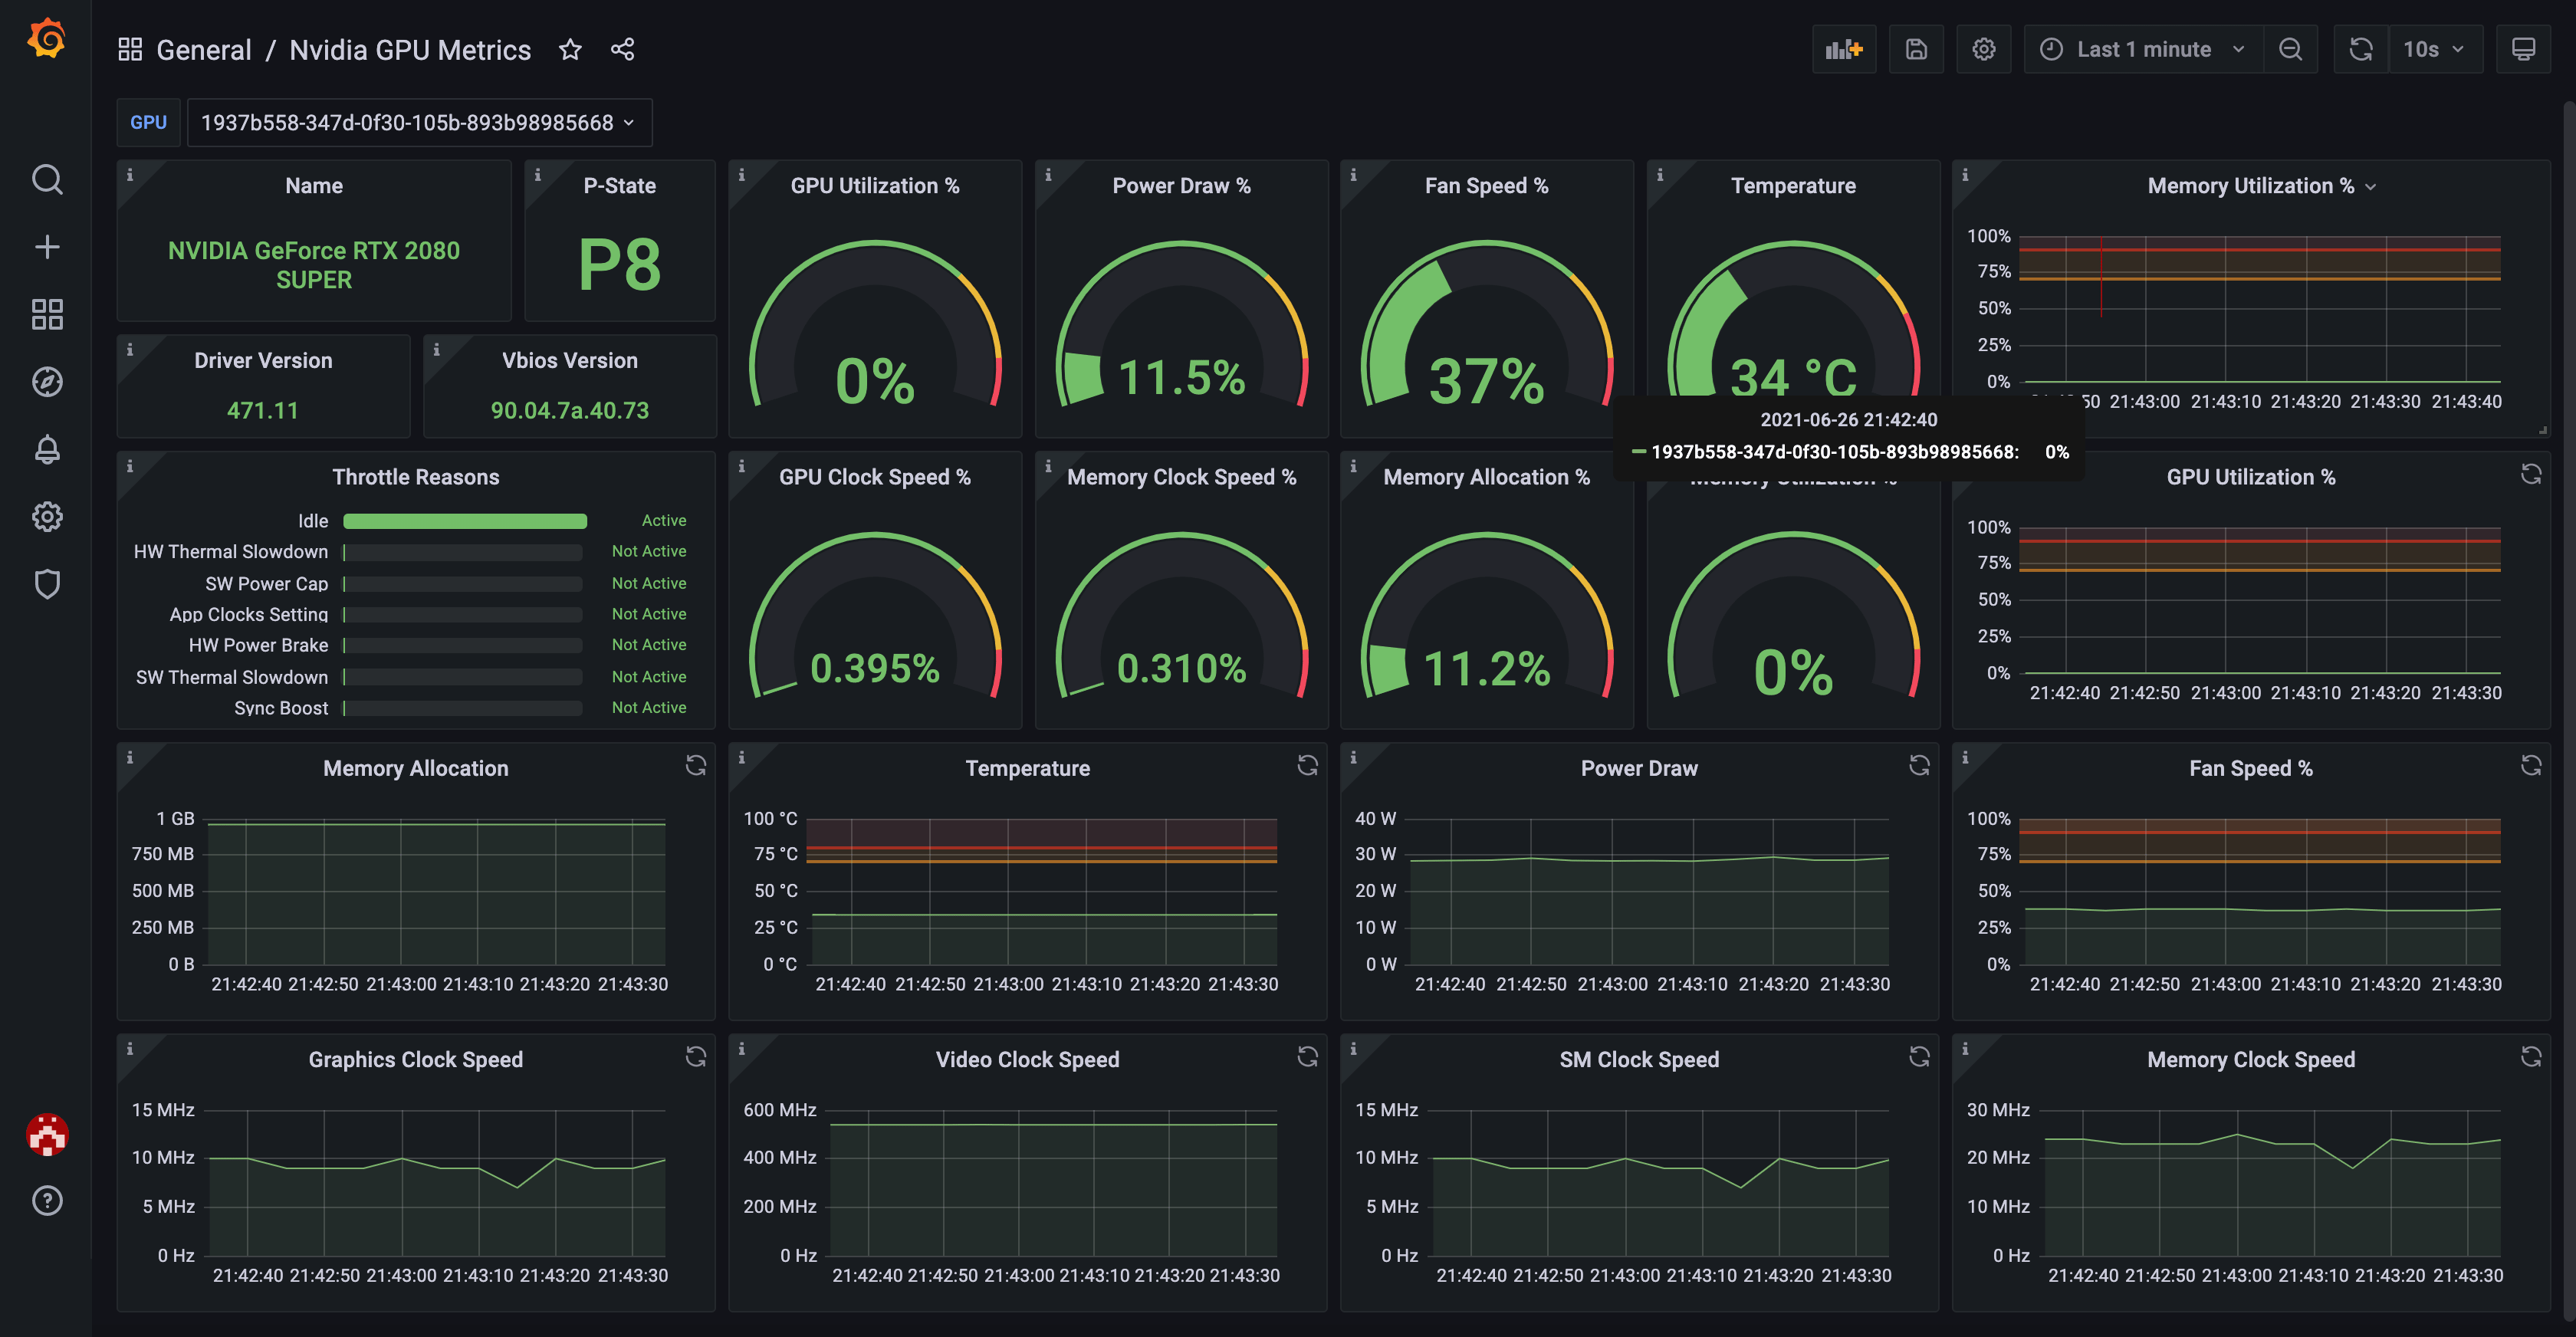
nvidia_gpu_exporter Nvidia GPU exporter for prometheus, using nvidia-smi binary to gather metrics. Introduction There are many Nvidia GPU exporters ou
Generate Prometheus rules for your SLOs
prometheus-slo Generates Prometheus rules for alerting on SLOs. Based on https://developers.soundcloud.com/blog/alerting-on-slos. Usage Build and Run
k6 prometheus output extension
xk6-prometheus A k6 extension implements Prometheus HTTP exporter as k6 output extension. Using xk6-prometheus output extension you can collect metric
Plays videos using Prometheus and Grafana, e.g. Bad Apple.

prometheus_video_renderer Plays videos using Prometheus and Grafana, e.g. Bad Apple. Modes Currently 3 different modes are supported. Bitmap The bitma
一个用Go编写的简单通用的Restful API项目,遵循SOLID原则
通用Restful API项目模板 欢迎使用,这是一个用Go编写的简单通用的Restful API项目,遵循SOLID原则。 部分灵感来自于 service-pattern-go 依赖 Gin Gorm Testify (Test & Mock framework) Mockery
Bootstrap curated Kubernetes stacks. Logging, metrics, ingress and more - delivered with gitops.
Gimlet Stack Bootstrap curated Kubernetes stacks. Logging, metrics, ingress and more - delivered with gitops. You can install logging aggregators, met
Exports Speedtest CLI metrics in the prometheus format, caching the results.

Exports Speedtest CLI metrics in the prometheus format, caching the results.
Plays videos using Prometheus, e.g. Bad Apple.

prom_bad_apple Plays videos using Prometheus, e.g. Bad Apple. Inspiration A while back I thought this blog post and the corresponding source code were
Prometheus exporter for Chia node metrics
chia_exporter Prometheus metric collector for Chia nodes, using the local RPC API Building and Running With the Go compiler tools installed: go build
Prometheus rule linter
pint pint is a Prometheus rule linter. Usage There are two modes it works in: CI PR linting Ad-hoc linting of a selected files or directories Pull Req
🦥 Easy and simple Prometheus SLO generator
Sloth Introduction Use the easiest way to generate SLOs for Prometheus. Sloth generates understandable, uniform and reliable Prometheus SLOs for any k
A tool to dump and restore Prometheus data blocks.

promdump promdump dumps the head and persistent blocks of Prometheus. It supports filtering the persistent blocks by time range. Why This Tool When de
📡 Prometheus exporter that exposes metrics from SpaceX Starlink Dish
Starlink Prometheus Exporter A Starlink exporter for Prometheus. Not affiliated with or acting on behalf of Starlink(™) 📡 Starlink Monitoring System
Automating Kubernetes Rollouts with Argo and Prometheus. Checkout the demo URL below

observe-argo-rollout Demo for Automating and Monitoring Kubernetes Rollouts with Argo and Prometheus Performing Demo The demo can be found on Katacoda
SigNoz helps developer monitor applications and troubleshoot problems in their deployed applications
SigNoz helps developers monitor their applications & troubleshoot problems, an open-source alternative to DataDog, NewRelic, etc. 🔥 🖥
gin-gonic/gin metrics for prometheus.

gin-metrics gin-gonic/gin metrics exporter for Prometheus. 中文 Introduction gin-metrics defines some metrics for gin http-server. There have easy way t
Prometheus support for go-metrics
go-metrics-prometheus This is a reporter for the go-metrics library which will post the metrics to the prometheus client registry . It just updates th
A tool to run queries in defined frequency and expose the count as prometheus metrics.

A tool to run queries in defined frequency and expose the count as prometheus metrics. Supports MongoDB and SQL
A set of tests to check compliance with the Prometheus Remote Write specification
Prometheus Compliance Tests This repo contains code to test compliance with various Prometheus standards. PromQL The promql directory contains code to
Like Prometheus, but for logs.
Loki: like Prometheus, but for logs. Loki is a horizontally-scalable, highly-available, multi-tenant log aggregation system inspired by Prometheus. It
Monitor your network and internet speed with Docker & Prometheus

Stand-up a Docker Prometheus stack containing Prometheus, Grafana with blackbox-exporter, and speedtest-exporter to collect and graph home Internet reliability and throughput.
A set of tests to check compliance with the Prometheus Remote Write specification
Prometheus Remote Write Compliance Test This repo contains a set of tests to check compliance with the Prometheus Remote Write specification. The test
Run Jobs on a schedule, supports fixed interval, timely, and cron-expression timers; Instrument your processes and expose metrics for each job.
A simple process manager that allows you to specify a Schedule that execute a Job based on a Timer. Schedule manage the state of this job allowing you to start/stop/restart in concurrent safe way. Schedule also instrument this Job and gather metrics and optionally expose them via uber-go/tally scope.
Squzy - is a high-performance open-source monitoring, incident and alert system written in Golang with Bazel and love.
Squzy - opensource monitoring, incident and alerting system About Squzy - is a high-performance open-source monitoring and alerting system written in
Metrics dashboards on terminal (a grafana inspired terminal version)
Grafterm Visualize metrics dashboards on the terminal, like a simplified and minimalist version of Grafana for terminal. Features Multiple widgets (gr
Easily generate gRPC services in Go ⚡️
Lile is a application generator (think create-react-app, rails new or django startproject) for gRPC services in Go and a set of tools/libraries. The p
A tool to run queries in defined frequency and expose the count as prometheus metrics. Supports MongoDB and SQL
query2metric A tool to run db queries in defined frequency and expose the count as prometheus metrics. Why ? Product metrics play an important role in
Doraemon is a Prometheus based monitor system

English | 中文 Doraemon Doraemon is a Prometheus based monitor system ,which are made up of three components——the Rule Engine,the Alert Gateway and the
A Go library for collecting sql.DBStats in Prometheus format
sqlstats A Go library for collecting sql.DBStats and exporting them in Prometheus format. A sql.DB object represents a pool of zero or more underlying
A beginner friendly introduction to prometheus 🔥
Prometheus-Basics A beginner friendly introduction to prometheus. Table of Contents What is prometheus ? What are metrics and why is it important ? Ba
Go products microservice
Golang Kafka gRPC MongoDB microservice example 👋 👨💻 Full list what has been used: Kafka - Kafka library in Go gRPC - gRPC echo - Web framework vip
Time Series Database based on Cassandra with Prometheus remote read/write support
SquirrelDB SquirrelDB is a scalable high-available timeseries database (TSDB) compatible with Prometheus remote storage. SquirrelDB store data in Cass
Creates Prometheus Metrics for PolicyReports and ClusterPolicyReports. It also sends PolicyReportResults to different Targets like Grafana Loki or Slack

PolicyReporter Motivation Kyverno ships with two types of validation. You can either enforce a rule or audit it. If you don't want to block developers
Translate Prometheus Alerts into Kubernetes pod readiness
prometheus-alert-readiness Translates firing Prometheus alerts into a Kubernetes readiness path. Why? By running this container in a singleton deploym
The open and composable observability and data visualization platform. Visualize metrics, logs, and traces from multiple sources like Prometheus, Loki, Elasticsearch, InfluxDB, Postgres and many more.
The open-source platform for monitoring and observability. Grafana allows you to query, visualize, alert on and understand your metrics no matter wher
⛅️ Prometheus metrics exporter for Cloudflare Analytics
cloudflare_exporter Prometheus metrics exporter for Cloudflare Analytics Description Prometheus metrics exporter for Cloudflare Analytics.
🦈 Prometheus exporter for pcap metrics
pcap-exporter 🦈 Prometheus exporter for pcap metrics Usage
Go gRPC RabbitMQ email microservice
Go, RabbitMQ and gRPC Clean Architecture microservice 👋 👨💻 Full list what has been used: GRPC - gRPC RabbitMQ - RabbitMQ sqlx - Extensions to data
Prometheus instrumentation library for Go applications
Prometheus Go client library This is the Go client library for Prometheus. It has two separate parts, one for instrumenting application code, and one
Open Source HTTP Reverse Proxy Cache and Time Series Dashboard Accelerator

Trickster is an HTTP reverse proxy/cache for http applications and a dashboard query accelerator for time series databases. Learn more below, and chec
Fully featured and highly configurable SFTP server with optional FTP/S and WebDAV support - S3, Google Cloud Storage, Azure Blob
SFTPGo Fully featured and highly configurable SFTP server with optional FTP/S and WebDAV support, written in Go. Several storage backends are supporte
Turn Nginx logs into Prometheus metrics
Nginx log parser and Prometheus exporter This service parses incoming syslog messages from Nginx sent over UDP and converts them into Prometheus metri
atomic measures + Prometheus exposition library
About Atomic measures with Prometheus exposition for the Go programming language. This is free and unencumbered software released into the public doma
Type-safe Prometheus metrics builder library for golang
gotoprom A Prometheus metrics builder gotoprom offers an easy to use declarative API with type-safe labels for building and using Prometheus metrics.
The Prometheus monitoring system and time series database.
Prometheus Visit prometheus.io for the full documentation, examples and guides. Prometheus, a Cloud Native Computing Foundation project, is a systems
GoWrap is a command line tool for generating decorators for Go interfaces
GoWrap GoWrap is a command line tool that generates decorators for Go interface types using simple templates. With GoWrap you can easily add metrics,
VictoriaMetrics: fast, cost-effective monitoring solution and time series database
VictoriaMetrics VictoriaMetrics is a fast, cost-effective and scalable monitoring solution and time series database. It is available in binary release
The Prometheus monitoring system and time series database.
Prometheus Visit prometheus.io for the full documentation, examples and guides. Prometheus, a Cloud Native Computing Foundation project, is a systems